

Home improvement statistics: remodeling spending, DIY share, projects by type and new-home trends (US)
US homeowners spent about 405 billion USD on home improvements in 2023, according to Harvard Joint Center for Housing Studies tabulations of the American Housing Survey, and DIY projects made up a record-low 15.9% of that. This page collects the main US figures on remodeling spending, DIY, projects by type and the forecast to mid-2027. It also tracks how new homes have changed since 2000 in floor area, siding and decks, using Census data, with a CSV and charts.
405billion USD
spent by US homeowners on improvements in 2023 (Harvard JCHS, from the American Housing Survey)
15.9% DIY
of that spending went on do-it-yourself projects, the lowest share on record
-13.2% vs 2015
change in the median size of a new US single-family home by 2025, against the 2015 record
(US Census Bureau (Survey of Construction, sponsored by HUD))
17.9% with a deck
of new US single-family homes completed in 2025, down from a quarter in 2010
(US Census Bureau (Survey of Construction, sponsored by HUD))
What are the main findings?
- Improvement spending is large and close to flat: about 405 billion USD in 2023, with Harvard's forecast near 519 billion USD for the year to mid-2027 and growth slowing to 0.5%.
- DIY is a shrinking slice: do-it-yourself work made up 15.9% of homeowner improvement spending in 2023, a record low.
- Flooring is the most common project, roofing the biggest by spend: 5.47 million homeowners reported flooring work and 4.15 million roofing work in 2023.
- New homes are getting smaller: the median new single-family home was 2,142 sq ft in 2025, the smallest since 2009.
- Fiber cement has caught up with vinyl and stucco: it was the main siding on 23% of new homes in 2025, a share that has more than doubled since Census first reported it.
- Patios have replaced decks on new homes: 17.9% of 2025 completions had a deck, while most had a patio.
The spending and DIY figures come from the 2023 American Housing Survey, the latest available. The new-home figures are for houses completed in 2025. Please keep the year with any figure you quote.
How much do Americans spend on home improvement?
US homeowners spent about 405 billion USD on improvements and repairs in 2023, according to Harvard's Joint Center for Housing Studies. US homeowners spent about $405 billion on home improvements in 2023, per Harvard JCHS tabulations of the 2023 American Housing Survey (Improving America's Housing 2025). The Joint Center works from the American Housing Survey, which asks owners what they did to their homes in the previous two years and what it cost.
A second measure comes from the Census Bureau's monthly construction spending survey, which counts spending by everyone, not only owner-occupiers. US private residential construction spending totalled about $923.4 billion in 2025, of which roughly $383.8 billion (41.6%) was outside new single-family and multifamily building, the part that covers owner improvements (Census C30). Census no longer publishes improvements as a separate line, so that share is a residual. It includes everything outside new homes and apartments, not only remodeling.
Spending is expected to stay roughly level. Harvard's Joint Center for Housing Studies (July 2026 LIRA) projects US homeowner spending on improvements and repairs at about $519 billion over the four quarters to mid-2027. The July 2026 LIRA expects year-over-year growth in US renovation and repair spending to slow to 0.5% by the second quarter of 2027 (Harvard JCHS). The Joint Center released a newer forecast on 22 October 2026 that we could not retrieve, so these figures are from the July 2026 release.
How many homeowners do their own improvement work?
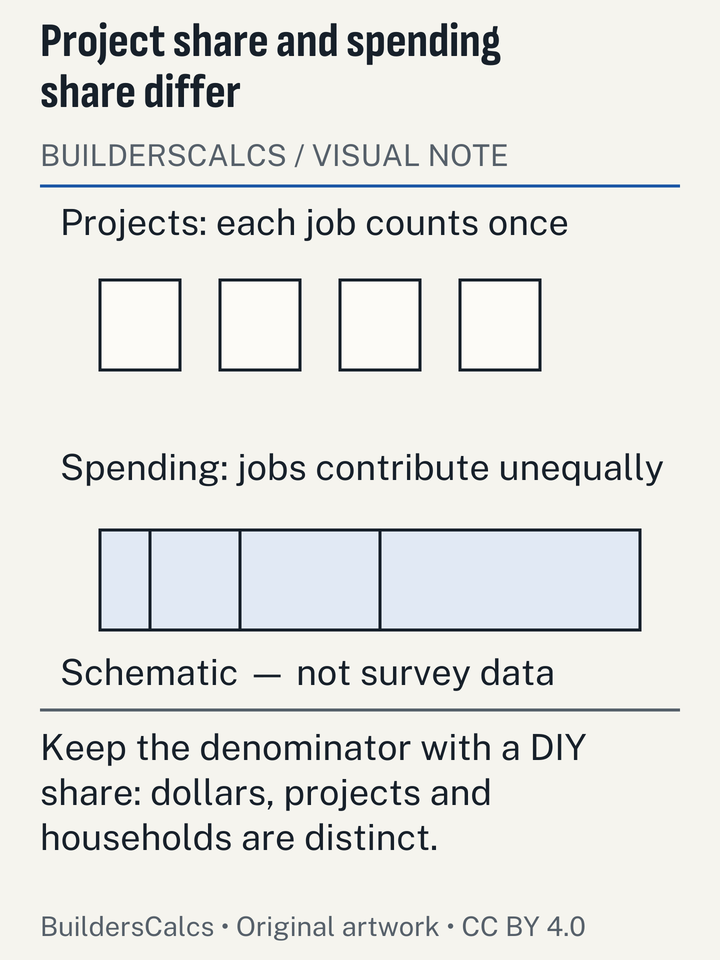
Fewer than at any time on record, measured by spending. DIY projects made up a record-low 15.9% of US homeowner improvement spending in 2023, down from about a quarter in the mid-2000s (Harvard JCHS, Improving America's Housing 2025). That share is by dollars, not by number of projects. DIY jobs are smaller and count only materials, so a much larger share of projects than of spending is still done by owners.
A typical DIY project is a fraction of the size of a hired one. Harvard JCHS put the typical DIY project in 2023 at 2,600 US dollars, materials only, against roughly three times that for the average professional project. The DIY figure is materials only, which is the part our calculators deal with: how many sheets, bags, boards or squares to buy.
A common belief is that DIY took off for good during the pandemic. The spending data do not show that. The DIY share has fallen over the long run, and by 2023 it was at its lowest point in the series. Plenty of people still do their own work, but the money in remodeling has moved further towards professionals.
What home improvement projects are most common?
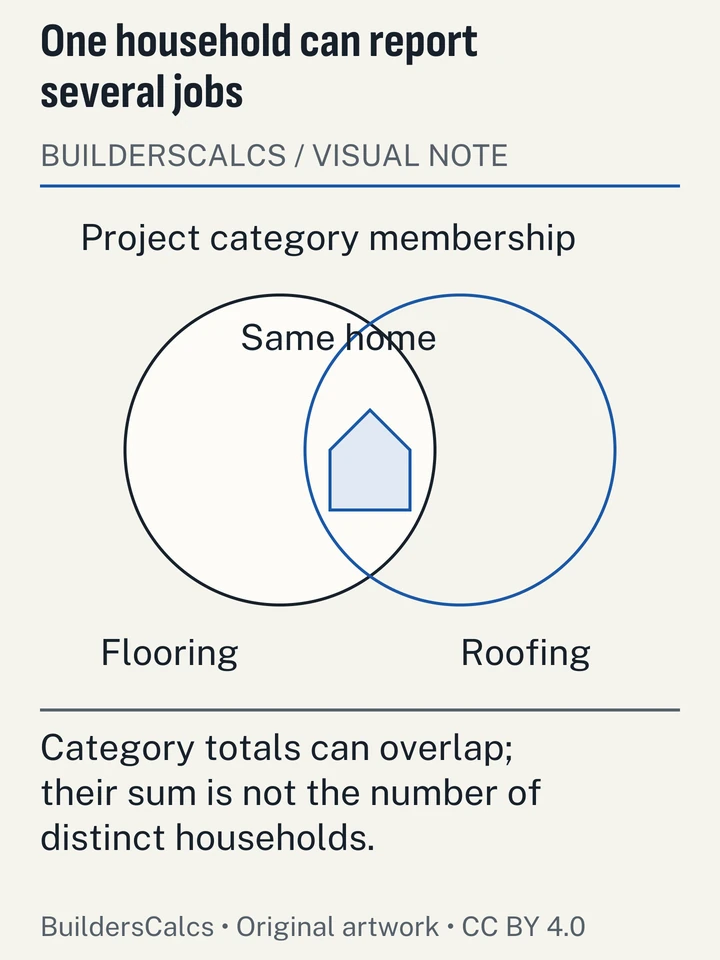
Flooring, roofing, windows and doors, and landscaping are the most commonly reported improvement projects. In 2023 each was reported by several million US homeowners, according to Harvard JCHS tabulations of the American Housing Survey. The bars show how many homeowners reported each type. Owners can report more than one type, so the groups overlap.
Which projects do homeowners spend the most on?
Roofing takes the largest share of spending among the exterior and finish projects tracked here. About 4.15 million US homeowners reported roofing replacement projects in 2023, totalling about $45.8 billion, the largest single exterior replacement category (Harvard JCHS Table A-1, 2023 AHS). Flooring is the most common project, but each job is smaller. About 5.47 million US homeowners reported carpeting, flooring, paneling or ceiling-tile projects in 2023, totalling about $25.0 billion (Harvard JCHS Table A-1, 2023 AHS).
Outdoor work is a large group too. About 1.93 million US homeowners added a porch, deck, patio or terrace in 2023, spending about $16.0 billion in total (Harvard JCHS Table A-1, 2023 AHS). About 2.85 million US homeowners reported fencing or wall projects in 2023, totalling about $10.7 billion (Harvard JCHS Table A-1, 2023 AHS). Insulation is common but cheap per job. About 1.53 million US homeowners reported insulation projects in 2023, totalling about $3.5 billion (Harvard JCHS Table A-1, 2023 AHS).
The table gives the count, average and total for each type. Averages mix DIY jobs, costed at materials only, with professional jobs, so they are not what a contractor would quote. They are not material prices either.
| Project type | Homeowners reporting (thousands) | Average spend (USD) | Total spend (million USD) |
|---|---|---|---|
| Roofing | 4,150 | 11,041 | 45,825 |
| Carpeting, flooring, paneling or ceiling tiles | 5,472 | 4,570 | 25,007 |
| Porch, deck, patio or terrace | 1,931 | 8,309 | 16,049 |
| Fencing or walls | 2,850 | 3,753 | 10,697 |
| Driveways or walkways | 2,297 | 4,465 | 10,254 |
| Landscaping or sprinkler systems | 3,520 | 3,698 | 13,017 |
| Siding | 1,132 | 8,346 | 9,445 |
| Windows or doors | 3,946 | 5,610 | 22,135 |
| Insulation | 1,528 | 2,263 | 3,458 |
| All improvements | 25,775 | 15,712 | 404,969 |
How can the project figures help plan a job?
They show where the money goes, but each project still starts with a measurement and a quantity. Typical sizes vary widely, so work from your own dimensions:
- Area first: the square feet from feet and inches tool handles odd room shapes and mixed units.
- Roofing, the largest spend: the roofing calculator turns a footprint and pitch into squares and bundles.
- Flooring, the most common job: the laminate with waste allowance tool rounds up to whole packs.
- Outdoor projects: the deck board calculator and the fence calculator count boards, posts and fasteners.
- Insulation: the insulation calculator gives bags or rolls for a target R-value.
To price those quantities, the material cost estimating guide sets out the steps, and the lumber and drywall price trends page shows how producer prices have moved since 2020.
How big is the average new home in 2025?
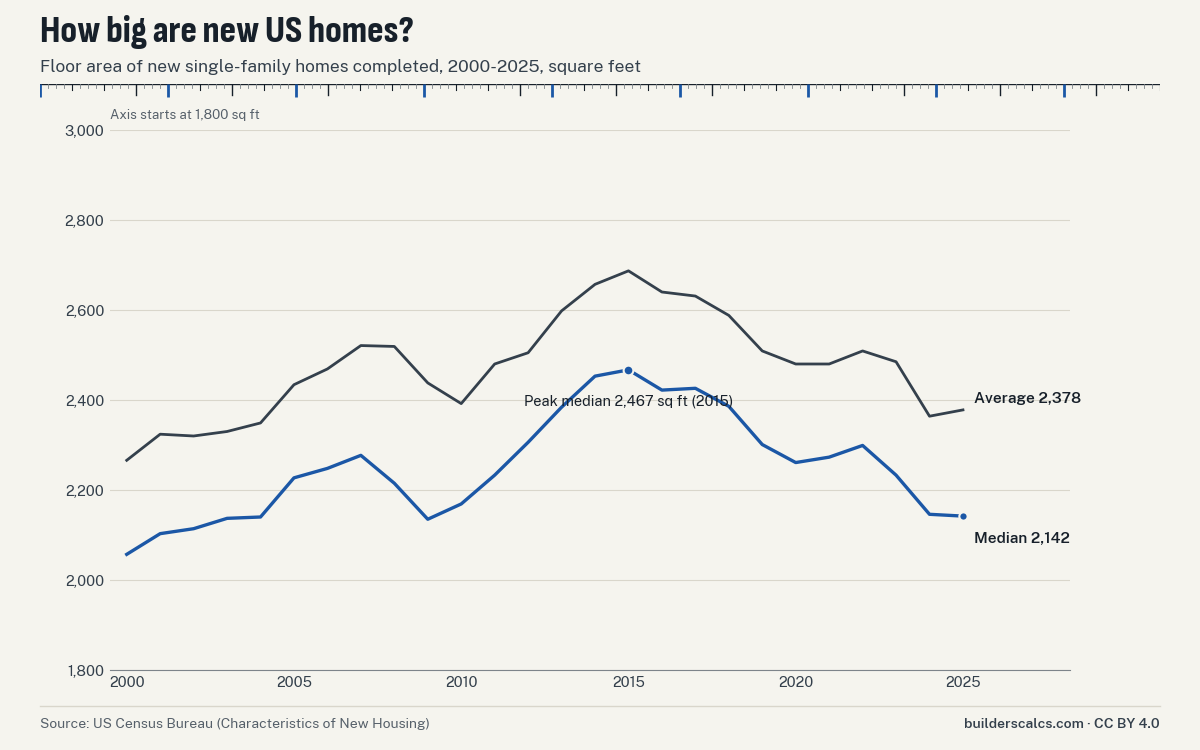
The median new single-family home completed in the US in 2025 had 2,142 sq ft of floor area, according to the Census Bureau. The median new US single-family home completed in 2025 had 2,142 sq ft of floor area, 13.2% smaller than the 2015 high of 2,467 sq ft in records back to 1973 and the smallest since 2009 (Census Characteristics of New Housing). The average is higher because a minority of very large homes pulls it up. Average floor area of new US single-family homes completed in 2025 was 2,378 sq ft, down from a peak of 2,687 sq ft in 2015 and 2,266 sq ft in 2000 (Census).
Size grew through the 2000s, dipped in the 2009 recession, rose to a record in 2015 and has fallen since. Large homes are rarer than they were. 7% of new US single-family homes completed in 2025 had 4,000 sq ft or more, against a high of 11% in 2014-2016; 11% were under 1,400 sq ft (Census). Region matters: the Northeast builds the largest new homes and the Midwest the smallest.
Floor area sets the scale of almost every material order: flooring, drywall, paint, insulation and roofing. A smaller median home means smaller typical orders, but a new home's figure tells you nothing about an existing one. Measure your own rooms rather than starting from an average.
| Year | US | Northeast | Midwest | South | West |
|---|---|---|---|---|---|
| 2015 | 2,467 | 2,492 | 2,320 | 2,517 | 2,435 |
| 2020 | 2,261 | 2,259 | 2,123 | 2,293 | 2,242 |
| 2023 | 2,233 | 2,478 | 2,101 | 2,270 | 2,126 |
| 2024 | 2,146 | 2,265 | 1,990 | 2,158 | 2,131 |
| 2025 | 2,142 | 2,459 | 1,969 | 2,162 | 2,090 |
What siding do new homes use?
Stucco and vinyl siding are tied as the most common exterior walls on new US homes, with fiber cement close behind. In 2025, stucco and vinyl siding were each the main exterior wall material on 26% of new US single-family homes, fiber cement on 23%, brick on 16% and wood on 6% (Census). Fiber cement's rise is the biggest change of the period. Fiber cement was the primary siding on 23% of new US single-family homes in 2025, up from 9% in 2005, the first year Census reported it separately.
Brick has lost ground. Brick was the main exterior wall material on 16% of new US single-family homes in 2025, versus 20% in 2000; vinyl siding peaked at 40% in 2002 (Census). The national figures hide sharp regional splits. Vinyl dominates in the Northeast and Midwest, stucco in the West, and the South uses brick, fiber cement and stucco in similar shares.
| Region | Vinyl siding (%) | Stucco (%) | Fiber cement (%) | Brick (%) | Wood (%) | Other (%) |
|---|---|---|---|---|---|---|
| United States | 26 | 26 | 23 | 16 | 6 | 2 |
| Northeast | 70 | 1 | 8 | 8 | 11 | 2 |
| Midwest | 64 | 0 | 12 | 4 | 16 | 3 |
| South | 21 | 23 | 24 | 26 | 3 | 3 |
| West | 5 | 55 | 31 | 1 | 7 | 1 |
Are fewer new homes built with decks?
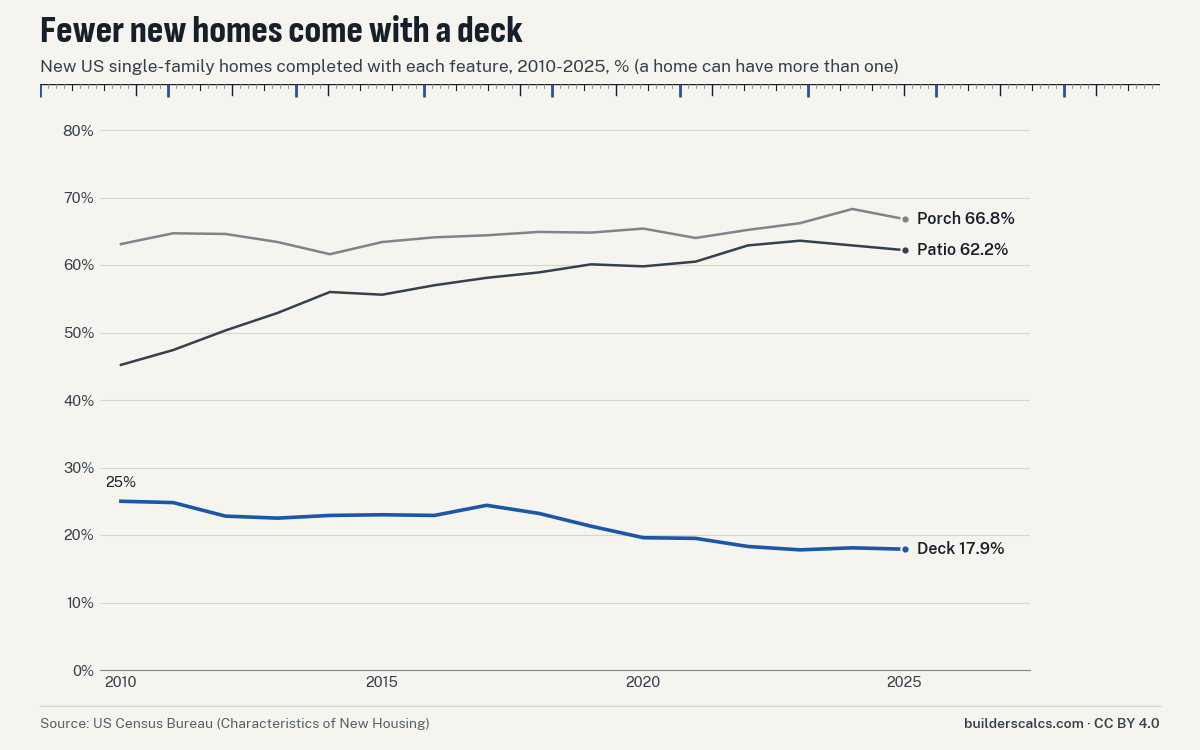
Yes. The share of new homes completed with a deck has fallen steadily since 2010, while patios have become the norm. About 17.9% of new US single-family homes completed in 2025 had a deck, down from 25% in 2010, while 62.2% had a patio and 66.8% a porch (computed from Census counts). In absolute numbers: About 625,000 of 1,005,000 new US single-family homes completed in 2025 (roughly 62%) included a patio, versus 180,000 with a deck and 84,000 with no patio, porch or deck (Census Bureau).
These figures cover homes as built, not decks added later. Many owners add a deck after moving in, and that work shows up in the project figures above, not here. A fall in decks on new homes does not mean fewer decks overall. The Census data cannot tell us why builders shifted to patios, so we do not guess.
| Year | With deck (%) | With patio (%) | With porch (%) | None of these (%) |
|---|---|---|---|---|
| 2010 | 25 | 45.2 | 63.1 | 14 |
| 2011 | 24.8 | 47.4 | 64.7 | 13 |
| 2012 | 22.8 | 50.3 | 64.6 | 12 |
| 2013 | 22.5 | 52.9 | 63.4 | 12 |
| 2014 | 22.9 | 56 | 61.6 | 11 |
| 2015 | 23 | 55.6 | 63.4 | 10 |
| 2016 | 22.9 | 57 | 64.1 | 9 |
| 2017 | 24.4 | 58.1 | 64.4 | 8 |
| 2018 | 23.2 | 58.9 | 64.9 | 8 |
| 2019 | 21.3 | 60.1 | 64.8 | 8 |
| 2020 | 19.6 | 59.8 | 65.4 | 8 |
| 2021 | 19.5 | 60.5 | 64 | 9 |
| 2022 | 18.3 | 62.9 | 65.2 | 7 |
| 2023 | 17.8 | 63.6 | 66.2 | 6 |
| 2024 | 18.1 | 62.9 | 68.3 | 6 |
| 2025 | 17.9 | 62.2 | 66.8 | 8 |
How many new homes are single-story, and what garages do they have?
About half. 48% of new US single-family homes completed in 2025 were one story, compared with 47% in 2009, the first year in the Census stories table. The single-story share has changed little since Census began this table, though it dipped in the early 2010s, when homes were at their largest.
Garages follow the size trend. 15% of new US single-family homes completed in 2025 had a garage for three or more cars (peak 24% in 2015), 64% a two-car garage and 9% no garage or carport (Census). The full yearly series for stories and parking is in the CSV.
How we built this data
Sources. Spending, DIY share and project counts come from the Joint Center for Housing Studies of Harvard University. Its Improving America's Housing 2025 report tabulates the Census Bureau's 2023 American Housing Survey. The forecast is from the Joint Center's Leading Indicator of Remodeling Activity, July 2026 release. Total residential spending is from the Census Bureau's construction spending survey (C30). New-home figures come from the Census Bureau's Characteristics of New Housing, part of the Survey of Construction, which HUD sponsors, for single-family homes completed from 2000 to 2025.
What we did. We put the spending and new-home figures on one page and built a long-format CSV of the Census tables, one row per year, topic, measure and category, with the source table named. Deck, patio and porch shares are our own calculations from published Census counts, because Census publishes those features as counts. Other shares are as Census publishes them.
Limits. The American Housing Survey runs every two years, so 2023 is the latest year for spending and DIY share. The survey covers owner-occupied homes and relies on owners' recall. Project categories overlap. The Census improvements figure is a residual, not a measured line. The Joint Center released a newer forecast on 22 October 2026 that we could not access, so the forecast is from July 2026. New-home data describe homes as completed, not later changes. Small categories, such as carports or 'other' wall materials, carry wide relative standard errors, which are not in the CSV. Census also rounds published percentages, so rows may not sum to 100.
How to cite this page
The tables, charts and CSV on this page are licensed under Creative Commons Attribution 4.0 (CC BY 4.0). Credit BuildersCalcs with a link to this page, and name the underlying source: Harvard JCHS for spending and DIY, the Census Bureau for new homes. The box at the end of the page copies a full citation.
A short form that works in most articles: 'the median new US single-family home completed in 2025 had 2,142 sq ft of floor area (Census Bureau data via BuildersCalcs)'. For the DIY share, say it is a share of spending in 2023, not of projects or of homeowners.
More sourced figures, including material prices, waste and injuries, are in the construction and DIY statistics library.
Download the data and charts
The CSV has one row per year, topic, measure and category for single-family homes completed from 2000 to 2025: floor area, size bands, exterior wall material, outdoor features, stories and parking. The charts are 1200 by 750 pixel PNGs. Everything is under CC BY 4.0.
- CSVCharacteristics of new US single-family homes, 2000–2025 (CSV)
- PNGChart: median and average new-home size, 2000–2025 (PNG)
- PNGChart: new homes with a deck, patio or porch, 2010–2025 (PNG)
Questions about home improvement figures
What share of home improvement spending is DIY?
15.9% in 2023, the lowest on record, according to Harvard JCHS from the American Housing Survey. That is a share of dollars. Because DIY projects count only materials and tend to be smaller, the share of projects done by owners is higher.
Why are the spending figures from 2023?
The American Housing Survey runs every two years and takes time to process, so 2023 is the latest year with detailed project data. The Joint Center's forecast gives a forward view to mid-2027.
Is the median or the average new-home size the better figure to quote?
The median, usually. A small number of very large homes pulls the average up, so the median, 2,142 sq ft in 2025, is closer to a typical new home. Give the year and say it is for single-family homes completed.
Do the new-home figures include homes built for rent?
Yes. Census counts single-family homes completed, including those built for rent. Apartments and other multifamily buildings are not included.
Cite this page
You may reuse the figures and downloads on this page under CC BY 4.0. Please credit BuildersCalcs with a link to this page.
Sources (12)
- Joint Center for Housing Studies of Harvard University
- Improving America's Housing 2025, checked
- Remodeling Spending Poised for Further Slowdown (LIRA release, 23 July 2026), checked
- US Census Bureau
- Characteristics of New Housing 2025: Presence of Outdoor Features in New Single-Family Houses Completed, checked
- Characteristics of New Housing 2025: Primary Type of Exterior Wall Material of New Single-Family Houses Completed, checked
- Characteristics of New Housing 2025: Square Feet of Floor Area in New Single-Family Houses Completed (incl. Median and Average Square Feet sheet), checked
- Highlights of 2025 Characteristics of New Housing, checked
- Value of Private Construction Put in Place - Not Seasonally Adjusted (privtime.xlsx), August 2026 release, checked
- US Census Bureau (Survey of Construction, sponsored by HUD)
- Characteristics of New Housing, 2025 annual tables: Number of Stories in New Single-Family Houses Completed (stories_cust.xls), checked
- Characteristics of New Housing, 2025 annual tables: Presence of Outdoor Features in New Single-Family Houses Completed (outdoorfeatures_cust.xls), checked
- Characteristics of New Housing, 2025 annual tables: Primary Type of Exterior Wall Material of New Single-Family Houses Completed (exwallmat_cust.xls), checked
- Characteristics of New Housing, 2025 annual tables: Square Feet of Floor Area in New Single-Family Houses Completed (squarefeet_cust.xls), checked
- Characteristics of New Housing, 2025 annual tables: Type of Parking Facility of New Single-Family Houses Completed (parking_cust.xls), checked
Every number on this page is taken from these documents. How we choose and check sources.