

How to estimate renovation material costs from your quantities
A material cost estimate is a list of lines, each one a purchase quantity multiplied by the price your local supplier charges for that unit, plus any delivery charge on their quote. Work out the net quantity, add the allowance its maker states, round up to whole bags, boxes or gallons, then price each line. We hold no prices, because they change by town and by month: US producer prices for residential repair goods were 54.1% above their 2020 average in September 2026, per the BLS.
What goes into a material cost estimate?
Four things go into every line: the quantity you will buy, the unit it is sold in, a dated price per unit from a named supplier, and the line total. Add the lines, then add charges that are not materials, such as delivery. Labour, permits and skip hire belong in other sections of the budget.
The first column is where estimates go wrong. The quantity you buy is not the area you measured. It is the measured quantity plus an allowance for cuts and breakage, converted into whole purchase units. A 40 sq ft floor is priced as a number of boxes, not as 40 sq ft of tile.
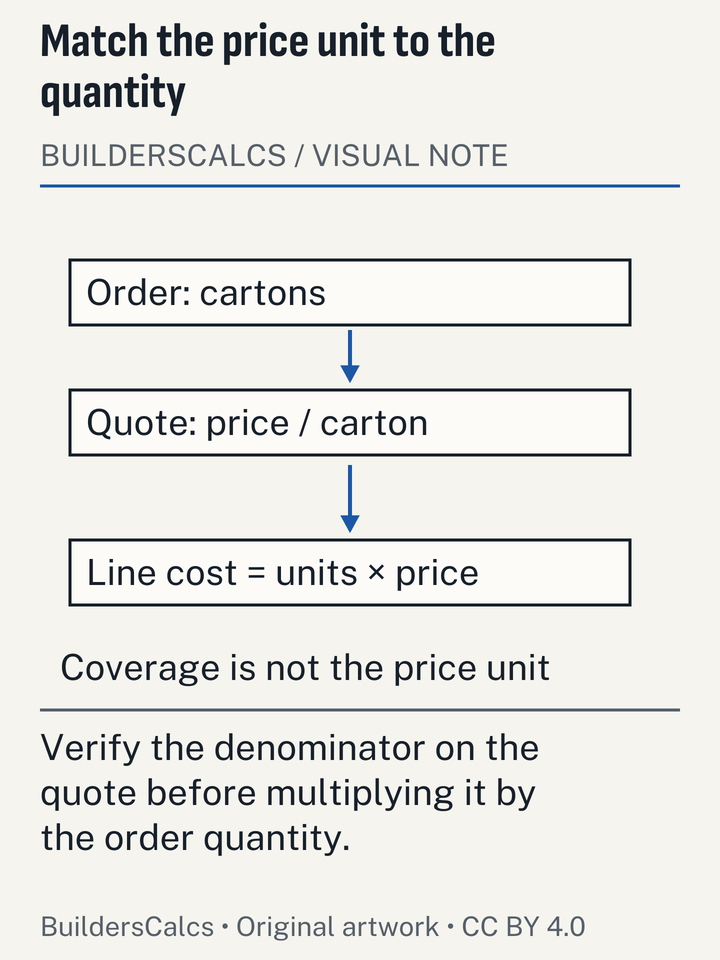
In short: purchase quantity × your local unit price = line total, with the allowance and rounding already inside the quantity, and delivery added only as your supplier quotes it.
How do you turn quantities into a budget, step by step?
Allowance first, rounding second, prices last. In that order you never pay for the same margin twice.
- List every material. Include the sundries. A tiled floor is tile, thinset, grout and spacers; a painted room is primer and topcoat.
- Calculate the net quantity. Measure in one unit and split odd shapes into rectangles. The square feet from feet and inches tool adds the pieces up.
- Add the stated allowance. Use your product's figure or the published one for the material and layout; see choosing 5%, 10% or 15% waste.
- Convert to purchase units and round up once. Flooring is sold in packs with a stated coverage; divide area plus allowance by pack coverage and round up.
- Price each unit locally, with a date. Use your supplier's website or a written quote. A price without a date cannot be checked later.
- Add delivery only as quoted. Delivery and minimum-load charges vary by supplier and distance, so there is no general figure to borrow.
- Keep contingency on its own line. If you want a margin for price rises, add it separately, not inside the waste allowance.
Worked example: what does a three-job budget sheet look like?
A bedroom repaint, a bathroom floor and a shed pad, worked through to the point where prices go in. The price column is yours to fill.
Bedroom repaint, 12 × 14 ft with 8 ft walls
The walls are 2 × (12 + 14) × 8 = 416 sq ft (38.6 m²). We hold no sourced door and window deduction, so they stay in as a small margin. Dulux Trade's normal system is two full coats (Dulux Trade (AkzoNobel)), so the paint covers 832 sq ft. Sherwin-Williams SuperPaint Interior Latex Flat covers 350-400 sq ft per gallon (8.59-9.82 m2/L) at 4 wet mils. At the low end, 832 ÷ 350 = 2.4, so 3 gallons. The how much paint a room needs tool runs this with your own sizes.
Bathroom floor, 5 × 8 ft in 30 × 60 cm porcelain
The floor is 40 sq ft (3.72 m²). With Fireclay Tile's 15% for field tile, the order is 46 sq ft, or 4.27 m². Marazzi packs this format six to a box covering 1.08 m² (Marazzi Group (Italy)), so 4.27 ÷ 1.08 = 3.96, which is 4 boxes. Thinset goes on the net floor: across Custom, LATICRETE and MAPEI, a 50 lb bag with a 1/4 × 3/8 in notch covers more than 40 sq ft (Custom Building Products, LATICRETE International and others), so one bag. The tile calculator handles other sizes.
Shed pad, 6 × 8 ft at 4 in thick
The pad is 6 × 8 × 4 ÷ 12 = 16 cu ft (0.45 m³). With the top of NRMCA's 4–10%, that is 17.6 cu ft. An 80 lb bag of concrete mix yields about 0.60 cu ft (17 L). So 17.6 ÷ 0.6 = 29.3, or 30 bags. The concrete volume and bag count tool covers slabs, footings and posts.
The example as a budget sheet
Copy the layout into a spreadsheet. Nothing in this table is a price.
| Line | Net quantity | Allowance used (stated by) | Purchase unit and coverage | Units to buy | Your price per unit | Line total |
|---|---|---|---|---|---|---|
| Interior flat paint, 2 coats | 832 sq ft of coat area (77.3 m²) | None; doors and windows left in | US gallon at the low end of SuperPaint's stated range | 3 gallons | From your quote, dated | 3 × price |
| Porcelain tile, 30 × 60 cm | 40 sq ft (3.72 m²) | 15% (Fireclay Tile) | Box of 6 pieces, 1.08 m² (Marazzi) | 4 boxes | From your quote, dated | 4 × price |
| Thinset, 1/4 × 3/8 in notch | 40 sq ft (3.72 m²) | None | 50 lb (22.7 kg) bag; coverage varies by brand | 1 bag | From your quote, dated | 1 × price |
| 80 lb concrete mix | 16 cu ft (0.45 m³) | 4–10%, top used (NRMCA) | 0.6 cu ft (17 L) per bag | 30 bags | From your quote, dated | 30 × price |
| Delivery | Not a material | Not applicable | As the supplier quotes it | 1 | Only if quoted | As quoted |
| Contingency (optional) | Your choice | Not a waste allowance | Percentage of the lines above | Your figure | Not applicable | Total × your % |
Why price from your own quotes instead of a national figure?
Because no national figure tells you what your supplier charges this week. The regularly published series, such as the US Producer Price Index, track what manufacturers receive, not what you pay at the counter. That is a common mix-up: retail prices add freight, the dealer's margin and timing lags on top (US Bureau of Labor Statistics, UK Department for Business and Trade and others). An index shows which way prices moved and how fast. It cannot become a price per bag. That is why the method asks for a dated source on every line, and why our formulas and data sources page publishes coverage and yields but no prices.
How much have building material prices moved since 2020?
A lot, and unevenly. Two BLS-based readings for the same basket differ because they start from different points. The Harvard JCHS summary puts US residential repair goods 54.1% above their 2020 average in September 2026. Measured from January 2020, our tracker gives 51.9% for the same series. Both are right for their base. The table lists each material, with steel products far ahead and ceramic tile furthest behind.
| Material (BLS PPI) | Since Jan 2020 (%) | 12-month change (%) | Peak month | From peak (%) |
|---|---|---|---|---|
| Inputs to residential construction (goods) | 55.8 | 9.7 | 2026–09 | 0 |
| Inputs to residential repair and remodeling (goods) | 51.9 | 9.7 | 2026–09 | 0 |
| Softwood lumber | 30.5 | 14.2 | 2021–05 | -50.4 |
| Plywood | 56 | 12.6 | 2021–06 | -35.6 |
| Softwood veneer and plywood | 66.5 | 15.9 | 2021–06 | -51.3 |
| Reconstituted wood products (OSB, particleboard, fiberboard mills) | 26.8 | 8 | 2022–03 | -57 |
| Gypsum products (drywall) | 49.3 | 1.4 | 2026–09 | 0 |
| Gypsum building materials | 50.9 | -0.4 | 2025–03 | -1.8 |
| Ready-mix concrete | 40.4 | 2.3 | 2026–06 | -0.2 |
| Cement | 38.5 | -1.2 | 2025–09 | -1.2 |
| Concrete block and brick | 50.4 | 3.6 | 2026–09 | 0 |
| Concrete pavers | 47.1 | 2.2 | 2026–04 | 0 |
| Clay brick and structural clay tile | 34.5 | 1 | 2026–08 | 0 |
| Sand, gravel and crushed stone | 56.7 | 6.3 | 2026–09 | 0 |
| Asphalt roofing and siding (shingles) | 47.7 | 2.7 | 2026–08 | -2 |
| Insulation materials | 51.9 | 2.7 | 2026–09 | 0 |
| Mineral wool building insulation | 52 | 1.6 | 2025–03 | -0.9 |
| Architectural coatings (paint) | 56.4 | 2.4 | 2026–09 | 0 |
| Ceramic and clay floor and wall tile | 14.8 | 0.8 | 2023–11 | -2.7 |
| Steel mill products | 107.5 | 27.6 | 2021–12 | -13.6 |
| Rebar and steel bar joists (fabricated) | 89.3 | 30 | 2026–09 | 0 |
Which materials have been the most volatile?
Lumber. US producer prices for softwood lumber rose 14.2% in the year to September 2026 but were still 50.4% below the May 2021 peak and only 3.0% above the 2020 average (BLS PPI). A lumber quote from spring 2021 would be far too high today, while a drywall quote from the same year would be too low. US producer prices for gypsum products, which include drywall, were 51.8% above the 2020 average in September 2026, the highest reading since at least 2019, and 1.4% up on a year earlier (BLS PPI). An older JCHS tabulation shows the same split: Harvard JCHS found lumber and plywood prices were still 21% above 2019 levels through Q3 2024, while insulation, gypsum and plastic construction products were 42-50% higher (BLS PPI tabulation).
United Kingdom
UK construction material prices for repair and maintenance work rose 5.9% in the year to August 2026 and were about 49% above the 2020 average (DBT building materials statistics, provisional). The table below shows the latest twelve months by material.
European Union
EU-27 producer prices for new residential buildings rose 3.6% in Q2 2026 from a year earlier and were about 37% above Q2 2020 (Eurostat sts_copi_q). That index covers new homes, so read it as direction, not as a refit figure.
| Material (ONS PPI) | Latest month | Index now (2015=100) | Index a year earlier | 12-month change (%) |
|---|---|---|---|---|
| Cement | 2026–08 | 140.7 | 141.9 | -0.8 |
| Ready-mixed concrete | 2026–08 | 156.7 | 157.8 | -0.7 |
| Precast concrete: blocks, bricks, tiles and flagstones | 2026–08 | 180.5 | 179.5 | 0.6 |
| Gravel, Sand, Clays and Kaolin - exc Aggregate Levy | 2026–08 | 151 | 147.3 | 2.5 |
| Concrete reinforcing bars (steel) | 2026–08 | 156 | 138.7 | 12.5 |
| Fabricated structural steel | 2026–08 | 171.9 | 141.8 | 21.2 |
| Insulating materials (thermal or acoustic) | 2026–08 | 206.7 | 198.1 | 4.3 |
| Paint (aqueous) | 2026–08 | 158.6 | 147.6 | 7.5 |
| Paint (non-aqueous) | 2026–08 | 150.4 | 143.6 | 4.7 |
| Imported sawn or planed wood | 2026–08 | 173.8 | 176.7 | -1.6 |
| Imported plywood | 2026–08 | 140.2 | 130.9 | 7.1 |
| Builders woodwork | 2026–08 | 169 | 162.3 | 4.1 |
How should price movement change your estimate?
It should change how long you trust a quote, not the quantities.
- Re-price the biggest lines before ordering if the quote is more than a few weeks old.
- Don't apply an index to a quote as a forecast. A category's past change says little about your merchant's next price list.
- Buy batch-matched materials in one order. Tile, wallpaper and some paints vary between batches, so a second order risks a new price and a different shade.
The monthly series are on the page showing how much material prices have risen since 2020.
How big are typical renovation material budgets?
Smaller than the headline totals suggest. Harvard JCHS put the typical US DIY home improvement project at 2,600 USD in 2023, counting materials only, about a third of the average professional project (Joint Center for Housing Studies of Harvard University). That is the typical owner-reported project in the 2023 American Housing Survey, not a target for yours.
DIY projects made up a record-low 15.9% of US homeowner improvement spending in 2023, down from about a quarter in the mid-2000s (Harvard JCHS, Improving America's Housing 2025). The total market is large: US homeowners spent about $405 billion on home improvements in 2023, per Harvard JCHS tabulations of the 2023 American Housing Survey (Improving America's Housing 2025). Harvard's Joint Center for Housing Studies (July 2026 LIRA) projects US homeowner spending on improvements and repairs at about $519 billion over the four quarters to mid-2027. The same release expects annual growth to slow to 0.5% by the second quarter of 2027. US private residential construction spending totalled about $923.4 billion in 2025, of which roughly $383.8 billion (41.6%) was outside new single-family and multifamily building, the part that covers owner improvements (Census C30). In Great Britain, Repair and maintenance construction output in Great Britain grew 0.4% in August 2026 while new work fell 0.7% (ONS, published 15 October 2026).
None of this prices your bathroom. It does show that an owner-done materials budget in the low thousands is normal, and that a total far from that deserves a line-by-line check. More national figures are on the home improvement statistics page.
What does over-ordering add to the bill?
Every unit of allowance is paid for at full price. Fireclay's 15% tile allowance adds that share to the tile line before box rounding, which can add more on a small floor. That is usually worth it, because running short means a second trip and a possible batch mismatch. But the allowance should be the maker's figure for your layout, not a habit. Ask whether unopened boxes can be returned, and don't stack margins. The guide on reading a coverage spec sheet shows where double-counting usually starts.
The waste side is well measured. Of the 600.3 million tons of US C&D debris in 2018, only 33.0 million tons came from waste during construction and 567.3 million tons from demolition, per EPA. For a single house, the EPA's estimate for new US homes was 4.38 lb per sq ft of debris per square foot of floor area (US EPA (prepared by Franklin Associates), EPA530-R-98-010). That 1996 figure is still the latest of its kind, so use it as a rough scale only.
Which costs are not materials, and how do you price them?
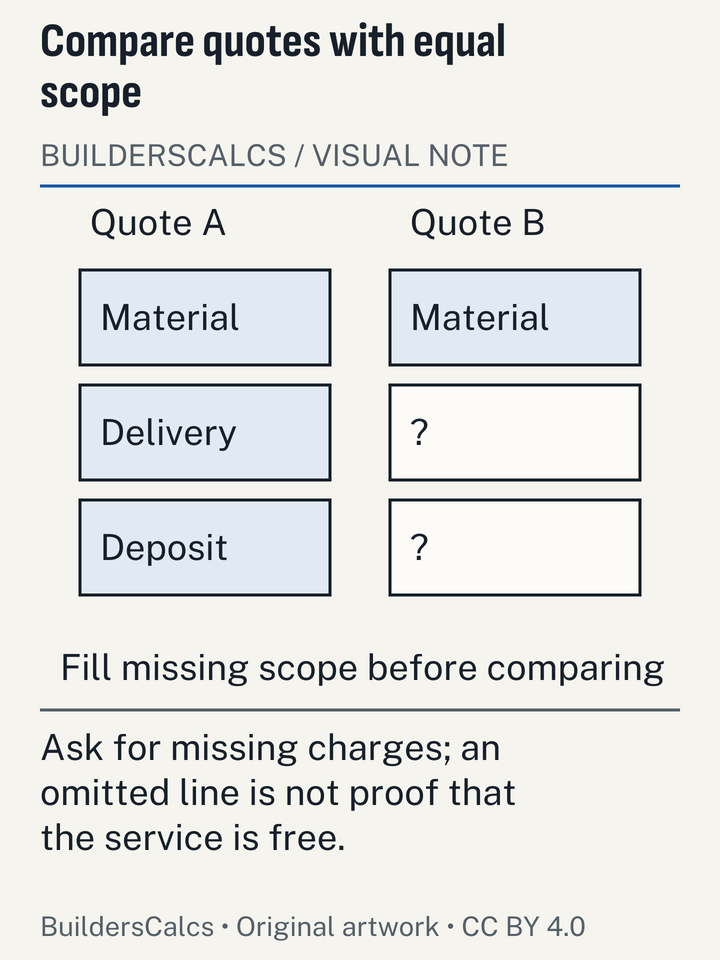
Delivery, minimum loads and pallet deposits are real costs with no general figure we could source, so take them only from a quote.
- Ready-mix concrete. Ready-mix is sold by the volume of fresh concrete discharged from the truck, in cubic yards or cubic metres. Minimum orders and part-load charges are set by each supplier; we found no authoritative US or UK figure. NRMCA advises re-measuring before the last two or three loads (National Ready Mixed Concrete Association).
- Bulk landscaping materials. Whether bulk beats bags depends on the delivery charge, so compare the two quotes for your quantity.
- Pallet deposits. Give them their own line so a refund is not forgotten.
When does a quantity-times-price estimate go wrong?
- Generic coverage. Box coverage differs by product and size (Marazzi Group (Italy) and Custom Building Products); use the label for what you buy.
- Missing sundries. Primer, grout, screws and underlayment add up.
- A margin applied twice, once to the area and again to the box count.
- A rough surface. On textured surfaces such as pebbledash the same masonry paint covers only 4-6 m2/L.
- A stale quote, especially for lumber.
- Mixed units. A UK gallon is larger than a US one, and UK concrete bags yield less than a US 80 lb bag.
The short version
Net quantity, plus the maker's allowance, rounded up to whole units, times your own dated local price. Add delivery only as quoted and keep contingency on its own line. Use price indices to judge how fast a quote dates, not to set the price. The other method pages are in the guide library.
Questions about estimating material costs
Do I pay full price for the waste allowance?
Yes. The allowance is material you buy at the same unit price. The saving is in not running short. Check whether your supplier takes back unopened packs.
How often should I re-price a material estimate?
Before ordering, if the prices are more than a few weeks old, and always for the biggest lines. Producer prices for softwood lumber moved 14.2% in the year to September 2026, so wood-heavy jobs date fastest.
Is a producer price index the same as what I pay at the store?
No. The PPI measures what manufacturers receive. Store prices add freight, margin and timing lags. Use an index to see movement, not to price a bag.
Should contingency go into the waste percentage?
Keep them apart. The waste allowance covers cuts and breakage and follows the maker's figure. Contingency covers price rises and surprises and is your own choice.
Sources (29)
- Custom Building Products
- Polyblend Sanded / Non-Sanded Grout color card and coverage chart (©2011), checked
- VersaBond Professional Tile Mortar product page - coverage table, checked
- Dulux Trade (AkzoNobel)
- Dulux Trade Vinyl Matt product page, checked
- Dulux Trade Weathershield Smooth Masonry Paint datasheet, checked
- Eurostat
- Construction producer prices or costs, new residential buildings - quarterly data (sts_copi_q), checked
- Producer prices in industry, domestic market - monthly data (sts_inppd_m), checked
- Fireclay Tile
- Tile School: How to Avoid an Add-On Order, checked
- Joint Center for Housing Studies of Harvard University
- Improving America's Housing 2025, checked
- Remodeling Spending Poised for Further Slowdown (LIRA release, 23 July 2026), checked
- LATICRETE International
- 253 GOLD sell sheet DS-167.6-EN-SP-0726 (©2026), checked
- MAPEI Corporation
- Ultraflex 2 technical data sheet (version Aug. 5, 2013), checked
- Marazzi Group (Italy)
- Plaster collection catalogue - formats and packing table, checked
- National Ready Mixed Concrete Association
- CIP 31 - Ordering Ready Mixed Concrete, checked
- CIP 8 - Discrepancies in Yield (rev. 2016), checked
- Office for National Statistics
- Construction output in Great Britain: August 2026, checked
- Pergo (Mohawk)
- Pergo Installation Essentials Guide (1/4 in expansion version), checked
- SAKRETE of North America
- SAKRETE Fast Setting Concrete Mix technical data sheet, hosted by Home Depot, checked
- SAKRETE High Strength Concrete Mix technical data sheet (REV 7-10), hosted by Home Depot, checked
- Sherwin-Williams
- SuperPaint Interior Latex Flat A86 Series product data sheet (101.02A), checked
- Ted Todd (UK wood flooring manufacturer)
- How to measure a room for wood flooring, checked
- The Quikrete Companies
- QUIKRETE Concrete Mix No. 1101 Data Sheet (revised Oct 2022), checked
- UK Department for Business and Trade
- Construction building materials: tables September 2026, checked
- Monthly Bulletin of Building Materials and Components, September 2026 (no. 617), Tables 1a, 2 and 3, checked
- US Bureau of Labor Statistics
- PPI series catalog files wp.series and pc.series (official series titles and index base dates), checked
- Producer Price Index by commodity (series WPU0811, WPU083, WPU137, WPU1322, WPU1333, WPU1321, WPU1342, WPU1344, WPU1361, WPU1392, WPU0621, WPU1231, WPU1232, WPUIP2321001), checked
- Producer Price Index monthly data, series WPUIP2311001, WPUIP2321001, WPU0811, WPU083, WPU0831, PCU321219321219, WPU137, WPU13710102, WPU1333, WPU1322, WPU1331, WPU13314101, WPU1342, WPU1321, WPU1361, WPU1392, WPU13920105, WPU062101, WPU1344, WPU1017, WPU1074051 (Jan 2020-September 2026), checked
- US Census Bureau
- Value of Private Construction Put in Place - Not Seasonally Adjusted (privtime.xlsx), August 2026 release, checked
- US EPA (prepared by Franklin Associates), EPA530-R-98-010
- Characterization of Building-Related Construction and Demolition Debris in the United States, checked
- US Environmental Protection Agency (EPA), Office of Resource Conservation and Recovery
- Advancing Sustainable Materials Management: 2018 Fact Sheet, checked
Every number on this page is taken from these documents. How we choose and check sources.