

Building material price tracker: how US, UK and EU material prices have moved since 2020
US producer prices for the goods that go into new homes were 55.8% higher in September 2026 than in January 2020, according to Bureau of Labor Statistics producer price indices that we rebased to January 2020. The September figure is preliminary. This page tracks 21 US series month by month, from softwood lumber and drywall to rebar, plus the UK government's construction material indices and Eurostat's EU producer prices. It shows how prices moved, not what a bag or sheet costs in your area.
55.8% since Jan 2020
rise in US producer prices for inputs to residential construction to September 2026 (preliminary)
30.5% since Jan 2020
rise in US softwood lumber prices, which are still about half their May 2021 peak
89.3% since Jan 2020
rise in US prices for fabricated rebar and bar joists, the steepest climb among the building products we track
44% since Jan 2021
rise in UK construction material prices for new housing to August 2026 (provisional)
What are the main findings?
- Residential building inputs hit a new high: US producer prices for goods used in new homes were 55.8% above January 2020 in September 2026, and 51.9% above it for repair and remodeling goods.
- Lumber is up, but far below its peak: softwood lumber was 30.5% above January 2020, yet less than half its May 2021 level.
- Drywall, insulation and paint are at their highest since 2020: gypsum products were up 49.3%, insulation 51.9% and architectural coatings 56.4%.
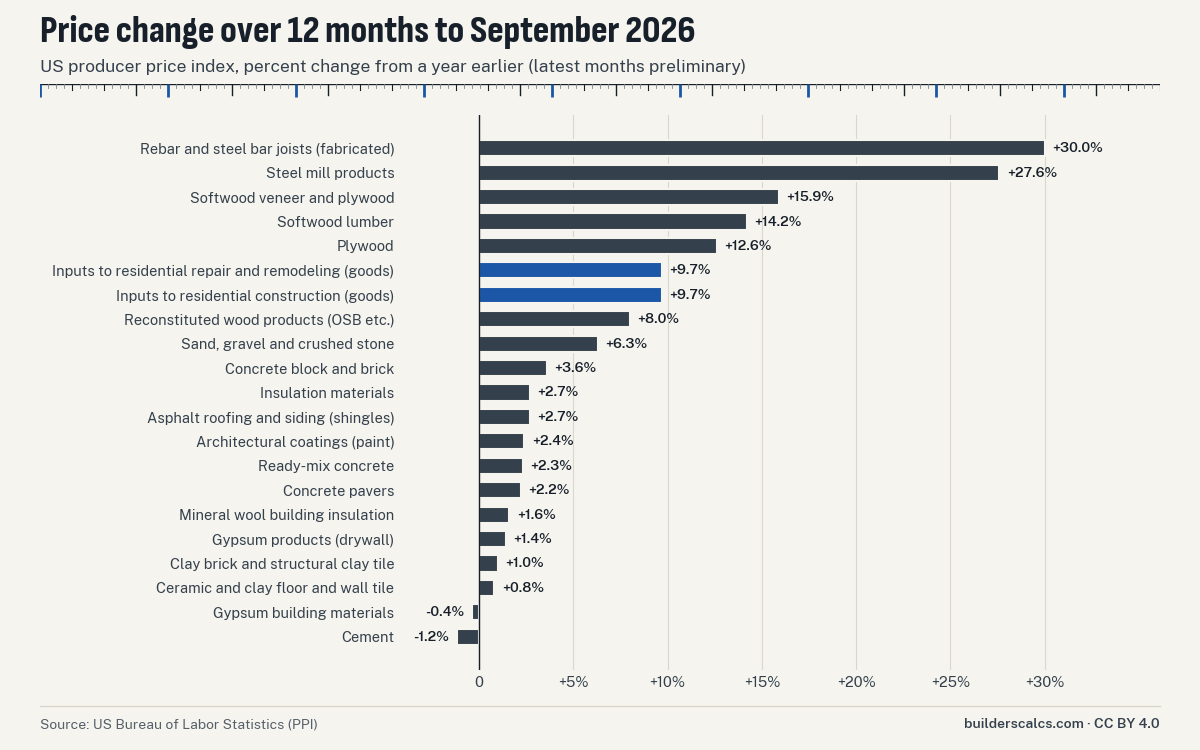
- Steel moved most in the past year: fabricated rebar and bar joists, and steel mill products, had by far the largest 12-month rises of any series, well ahead of lumber.
- Ceramic tile barely moved: 14.8% over the whole period, the smallest rise in the US set.
- The UK and EU tell a similar story: UK new-housing material prices were 44% above January 2021, and EU27 ready-mixed concrete 47.2% above January 2020.
The last four US months (June to September 2026) are preliminary, and BLS revises them. UK figures for the last three months are provisional. Please quote the month and the word 'preliminary' or 'provisional' with any recent figure.
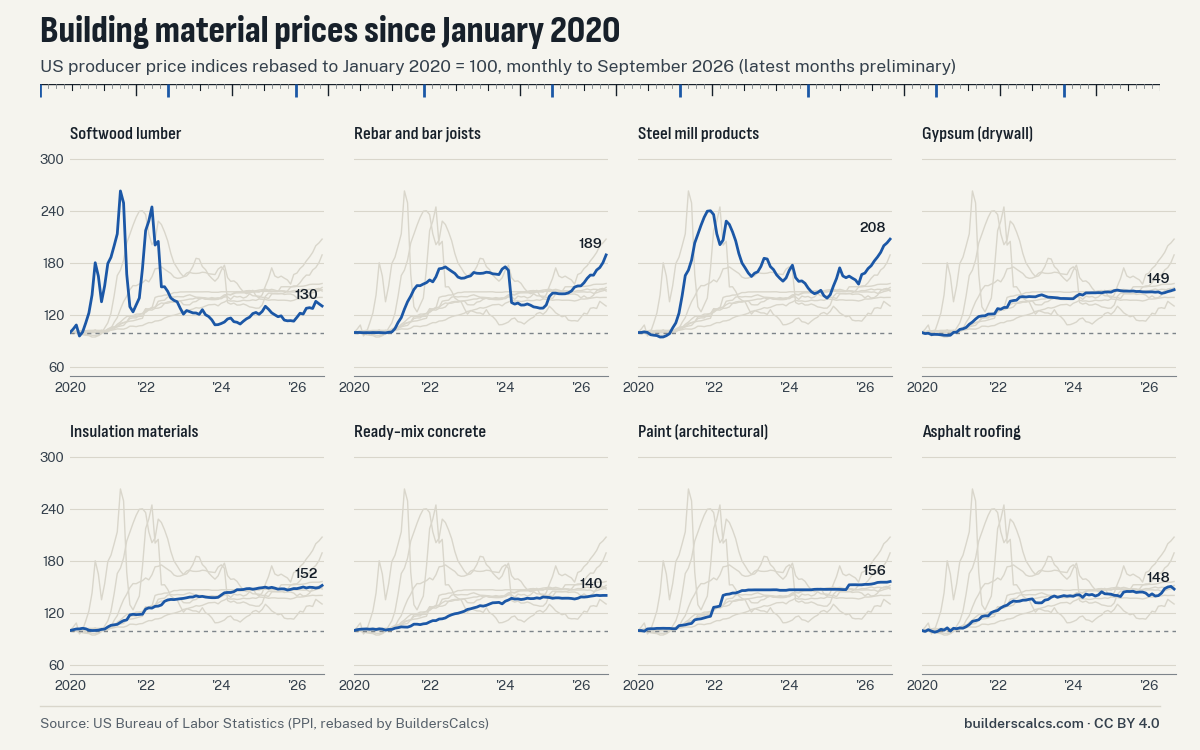
How much have building material prices gone up since 2020?
Nearly every US building material sold for much more at the producer level in September 2026 than in January 2020, according to BLS producer price indices. The broad measure for new homes, the index of inputs to residential construction, rose 55.8% over that time. That figure is a weighted bundle of goods builders buy: lumber, panels, concrete, metals, roofing, insulation, fixtures and more.
The path was not a steady climb. The bundle rose fast through 2021 and the first half of 2022, eased in late 2022 and 2023, then held roughly flat until late 2025. It picked up again in 2026 and reached its highest level of the period in September. US producer prices for inputs to residential construction (goods) were 55.8% higher in September 2026 (preliminary) than in January 2020, up 9.7% on a year earlier and at the highest level since at least January 2020 (BLS PPI WPUIP2311001).
Single materials spread widely around that average. Steel products and plywood rose faster than the bundle. Cement, ready-mix concrete and clay brick rose more slowly. Ceramic floor and wall tile hardly moved. The table gives every series we track, with its September 2026 change against January 2020, against a year earlier, and against its highest month since 2020.
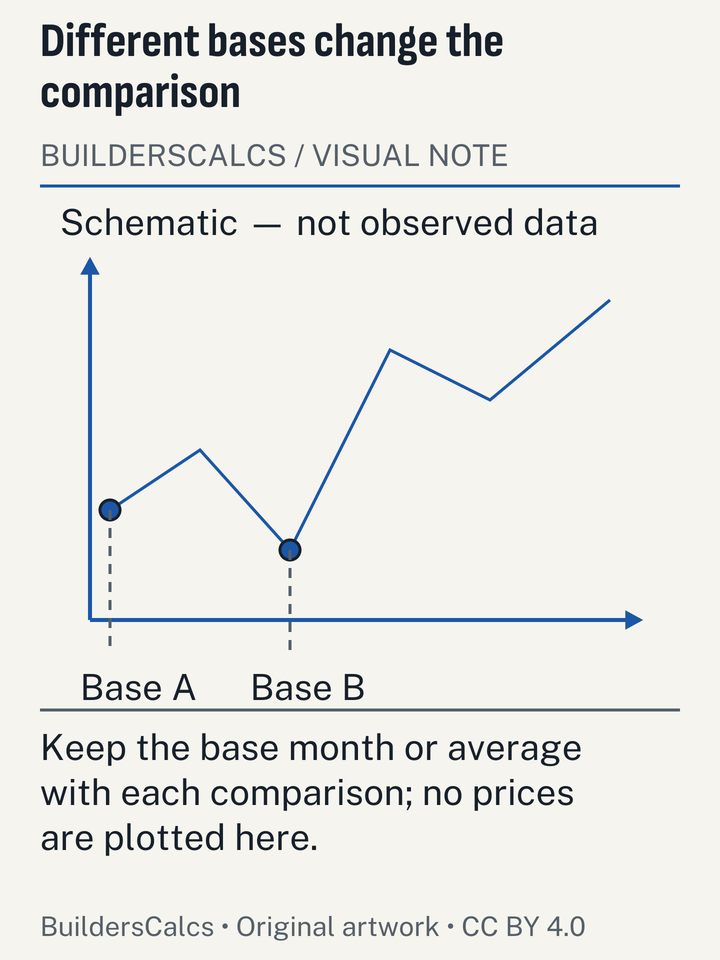
Illustration sources
- US Bureau of Labor Statistics — Producer Price Index monthly data, series WPUIP2311001, WPUIP2321001, WPU0811, WPU083, WPU0831, PCU321219321219, WPU137, WPU13710102, WPU1333, WPU1322, WPU1331, WPU13314101, WPU1342, WPU1321, WPU1361, WPU1392, WPU13920105, WPU062101, WPU1344, WPU1017, WPU1074051 (Jan 2020-September 2026)
- BLS — Producer Price Index overview
| Material | BLS series | Since Jan 2020 (%) | 12-month change (%) | Peak month | From peak (%) |
|---|---|---|---|---|---|
| Inputs to residential construction (goods) | WPUIP2311001 | 55.8 | 9.7 | 2026–09 | 0 |
| Inputs to residential repair and remodeling (goods) | WPUIP2321001 | 51.9 | 9.7 | 2026–09 | 0 |
| Softwood lumber | WPU0811 | 30.5 | 14.2 | 2021–05 | -50.4 |
| Plywood | WPU083 | 56 | 12.6 | 2021–06 | -35.6 |
| Softwood veneer and plywood | WPU0831 | 66.5 | 15.9 | 2021–06 | -51.3 |
| Reconstituted wood products (OSB, particleboard, fiberboard mills) | PCU321219321219 | 26.8 | 8 | 2022–03 | -57 |
| Gypsum products (drywall) | WPU137 | 49.3 | 1.4 | 2026–09 | 0 |
| Gypsum building materials | WPU13710102 | 50.9 | -0.4 | 2025–03 | -1.8 |
| Ready-mix concrete | WPU1333 | 40.4 | 2.3 | 2026–06 | -0.2 |
| Cement | WPU1322 | 38.5 | -1.2 | 2025–09 | -1.2 |
| Concrete block and brick | WPU1331 | 50.4 | 3.6 | 2026–09 | 0 |
| Concrete pavers | WPU13314101 | 47.1 | 2.2 | 2026–04 | 0 |
| Clay brick and structural clay tile | WPU1342 | 34.5 | 1 | 2026–08 | 0 |
| Sand, gravel and crushed stone | WPU1321 | 56.7 | 6.3 | 2026–09 | 0 |
| Asphalt roofing and siding (shingles) | WPU1361 | 47.7 | 2.7 | 2026–08 | -2 |
| Insulation materials | WPU1392 | 51.9 | 2.7 | 2026–09 | 0 |
| Mineral wool building insulation | WPU13920105 | 52 | 1.6 | 2025–03 | -0.9 |
| Architectural coatings (paint) | WPU062101 | 56.4 | 2.4 | 2026–09 | 0 |
| Ceramic and clay floor and wall tile | WPU1344 | 14.8 | 0.8 | 2023–11 | -2.7 |
| Steel mill products | WPU1017 | 107.5 | 27.6 | 2021–12 | -13.6 |
| Rebar and steel bar joists (fabricated) | WPU1074051 | 89.3 | 30 | 2026–09 | 0 |
Which materials have risen the most since January 2020?
Steel mill products and fabricated rebar have risen the most since January 2020, well ahead of every other series. Plywood, architectural paint and sand, gravel and crushed stone come next, each up by more than half. At the other end, ceramic tile and reconstituted wood panels such as OSB have risen least. The bars show the change from January 2020 to September 2026 for each series.
What happened to lumber prices?
Softwood lumber rose sharply in the past year but remains far below its 2021 peak. US producer prices for softwood lumber were 30.5% higher in September 2026 (preliminary) than in January 2020, up 14.2% on a year earlier and 50.4% below the May 2021 peak (BLS PPI WPU0811). Lumber is the most volatile series in the set. It more than doubled between spring 2020 and May 2021, fell back, spiked again in early 2022, and spent 2023 and 2024 drifting lower.
The starting point changes the story, and this is the most common misreading of lumber figures. Against the 2020 annual average, which already includes the late-2020 surge, the same September index looks almost flat. US producer prices for softwood lumber rose 14.2% in the year to September 2026 but were still 50.4% below the May 2021 peak and only 3.0% above the 2020 average (BLS PPI). Both statements are correct. They use different base periods, so check which one an article uses before comparing it with ours.
Panels followed lumber with a lag. US producer prices for plywood were 56.0% higher in September 2026 (preliminary) than in January 2020, up 12.6% on a year earlier and 35.6% below the June 2021 peak (BLS PPI WPU083). BLS stopped publishing a separate OSB index in 2019. The nearest live series is the index for reconstituted wood product mills, which covers OSB, particleboard and fiberboard. It is in the table and the CSV, but it is a proxy, not an OSB price.
For a deck, fence or framing job, the lumber index explains why a quote from 2021 looks nothing like one from today. To plan the boards themselves, the board count for a new deck works out boards, joists and screws from the deck size.
Are drywall, insulation and concrete prices still rising?
Drywall and insulation prices are at their highest since 2020, but their rise has slowed to a few percent a year. US producer prices for gypsum products (drywall) were 49.3% higher in September 2026 (preliminary) than in January 2020, up 1.4% on a year earlier and at the highest level since at least January 2020 (BLS PPI WPU137). US producer prices for insulation materials were 51.9% higher in September 2026 (preliminary) than in January 2020, up 2.7% on a year earlier and at the highest level since at least January 2020 (BLS PPI WPU1392). Both climbed steadily through 2021 and 2022 and have crept up since, without the swings seen in lumber.
Concrete is flatter still. US producer prices for ready-mix concrete were 40.4% higher in September 2026 (preliminary) than in January 2020, up 2.3% on a year earlier and 0.2% below the June 2026 peak (BLS PPI WPU1333). Cement itself is slightly cheaper at the producer level than a year ago. US producer prices for cement were 38.5% higher in September 2026 (preliminary) than in January 2020, down 1.2% on a year earlier and 1.2% below the September 2025 peak (BLS PPI WPU1322). Concrete block and brick reached a new high in September. US producer prices for concrete block and brick were 50.4% higher in September 2026 (preliminary) than in January 2020, up 3.6% on a year earlier and at the highest level since at least January 2020 (BLS PPI WPU1331).
Roofing and paint sit in the same band. US producer prices for asphalt roofing and siding (shingles) were 47.7% higher in September 2026 (preliminary) than in January 2020, up 2.7% on a year earlier and 2.0% below the August 2026 peak (BLS PPI WPU1361). US producer prices for architectural coatings (paint) were 56.4% higher in September 2026 (preliminary) than in January 2020, up 2.4% on a year earlier and at the highest level since at least January 2020 (BLS PPI WPU062101). The longer view is consistent with the Harvard Joint Center for Housing Studies, which worked from the same BLS data. Harvard JCHS found lumber and plywood prices were still 21% above 2019 levels through Q3 2024, while insulation, gypsum and plastic construction products were 42-50% higher (BLS PPI tabulation).
The quantities behind these products are what the drywall calculator, the attic insulation quantity tool and the concrete volume and bag count tool work out. The roof squares and shingle bundles tool does the same for a roof.
How much have steel and rebar prices risen?
Steel has moved more than any other material in the past twelve months. US producer prices for rebar and steel bar joists (fabricated) were 89.3% higher in September 2026 (preliminary) than in January 2020, up 30.0% on a year earlier and at the highest level since at least January 2020 (BLS PPI WPU1074051). US producer prices for steel mill products were 107.5% higher in September 2026 (preliminary) than in January 2020, up 27.6% on a year earlier and 13.6% below the December 2021 peak (BLS PPI WPU1017). Steel mill products peaked in December 2021, fell through 2024, and have risen again since 2025. Fabricated rebar is at its highest level of the period.
For most DIY jobs, steel is a small share of the material bill: rebar in a slab or footing, fasteners, connectors. For contractors pricing foundations and framed floors, it matters more. These indices do not say why steel prices moved, and we do not try to explain it here.
How have UK construction material prices changed?
UK construction material prices have risen by a similar order to US prices, but over a shorter published window. The Department for Business and Trade's monthly tables start in January 2021. UK construction material prices for new housing were 44.0% higher in August 2026 (provisional) than in January 2021 and 5.6% higher than a year earlier (DBT construction material price index). For the repair and maintenance work most homeowners pay for: UK material prices for repair and maintenance work rose 5.9% in the year to August 2026 (provisional), to 168.1 against 2015=100 (DBT construction material price index).
Steel again leads the annual rises. UK producer prices for fabricated structural steel rose 21.2% in the year to August 2026 (provisional), the largest annual rise among the construction materials in DBT Table 2 (DBT, ONS data). UK producer prices for concrete reinforcing bars (steel) rose 12.5% in the year to August 2026 (provisional), from 138.7 to 156.0 (2015=100) (DBT, ONS data). Cement and ready-mixed concrete were slightly down on a year earlier. Insulation stands out over the long run. UK producer prices for thermal and acoustic insulating materials stood at 206.7 in August 2026, roughly double 2015 levels, and 4.3% higher than a year earlier (DBT Table 2, ONS data).
The UK indices use 2015 as 100, so their levels cannot be set against the US rebased series directly. Compare percentage changes over the same months instead. DBT rates each series for quality. Imported plywood carries its lowest rating, which means few price quotes stand behind it.
| Material | DBT quality rating | Aug 2026 (provisional) | Aug 2025 | 12-month change (%) | 2021 average | 2025 average |
|---|---|---|---|---|---|---|
| Cement | A | 140.7 | 141.9 | -0.8 | 110.7 | 143.2 |
| Ready-mixed concrete | A | 156.7 | 157.8 | -0.7 | 107.5 | 156.6 |
| Precast concrete: blocks, bricks, tiles and flagstones | A | 180.5 | 179.5 | 0.6 | 119.3 | 177 |
| Gravel, Sand, Clays and Kaolin - exc Aggregate Levy | A | 151 | 147.3 | 2.5 | 113.2 | 149.3 |
| Concrete reinforcing bars (steel) | A | 156 | 138.7 | 12.5 | 152.5 | 141.6 |
| Fabricated structural steel | A | 171.9 | 141.8 | 21.2 | 173 | 144.9 |
| Insulating materials (thermal or acoustic) | A | 206.7 | 198.1 | 4.3 | 130.3 | 197.2 |
| Paint (aqueous) | A | 158.6 | 147.6 | 7.5 | 114.6 | 145.7 |
| Paint (non-aqueous) | A | 150.4 | 143.6 | 4.7 | 107.9 | 140.9 |
| Imported sawn or planed wood | A | 173.8 | 176.7 | -1.6 | 188.6 | 169.8 |
| Imported plywood | F | 140.2 | 130.9 | 7.1 | 153.2 | 132.6 |
| Builders woodwork | A | 169 | 162.3 | 4.1 | 130.5 | 162.4 |
How do EU material prices compare?
EU27 producer prices rose in every construction-material industry we track between January 2020 and August 2026, according to Eurostat. EU27 domestic producer prices for sawn and planed wood were 4.6% higher in August 2026 than a year earlier and 58.0% above January 2020 (Eurostat). EU27 domestic producer prices for ready-mixed concrete were 47.2% higher in August 2026 than in January 2020 and 4.7% up on a year earlier (Eurostat).
Eurostat's figures cover whole industries, such as concrete products or plaster products, rather than single products like a sheet of plasterboard. They are domestic producer prices, not import prices. Eurostat also tracks the cost of building a new home, a measure that includes labour and other inputs as well as materials. EU-27 producer prices for new residential buildings rose 3.6% in Q2 2026 from a year earlier and were about 37% above Q2 2020 (Eurostat sts_copi_q).
| Industry | Latest month | Since Jan 2020 (%) | 12-month change (%) | Peak month |
|---|---|---|---|---|
| Sawn and planed wood | 2026–08 | 58 | 4.6 | 2022–05 |
| Wood products (incl. panels, joinery) | 2026–08 | 36.9 | 4.7 | 2022–10 |
| Paints, varnishes and coatings | 2026–08 | 31 | 4.9 | 2026–08 |
| Clay bricks and tiles | 2026–08 | 48.7 | 3.7 | 2026–08 |
| Concrete products | 2026–08 | 37.8 | 4.1 | 2026–08 |
| Plaster products | 2026–08 | 40.1 | 2.1 | 2025–03 |
| Ready-mixed concrete | 2026–08 | 47.2 | 4.7 | 2026–08 |
| Other non-metallic mineral products (incl. mineral wool) | 2026–08 | 40.4 | 6.5 | 2026–06 |
| Basic iron and steel | 2026–08 | 45.2 | 7.8 | 2022–05 |
Do these indices show what you will pay for materials?
No. A producer price index measures what manufacturers and mills receive for their goods, not what a homeowner pays at a builders' merchant or home center. Retail prices add freight, the dealer's margin and the lag between a mill price change and the shelf. A given move in a producer index does not mean the same move in your quote, and it can reach the shelf weeks or months later, if it does at all.
What the indices are good for is direction and scale. They show which materials have become relatively dearer since an old estimate was drawn up. They also show whether a supplier's increase is in line with the market, and which line items in a budget are most exposed to swings. Lumber is the obvious case.
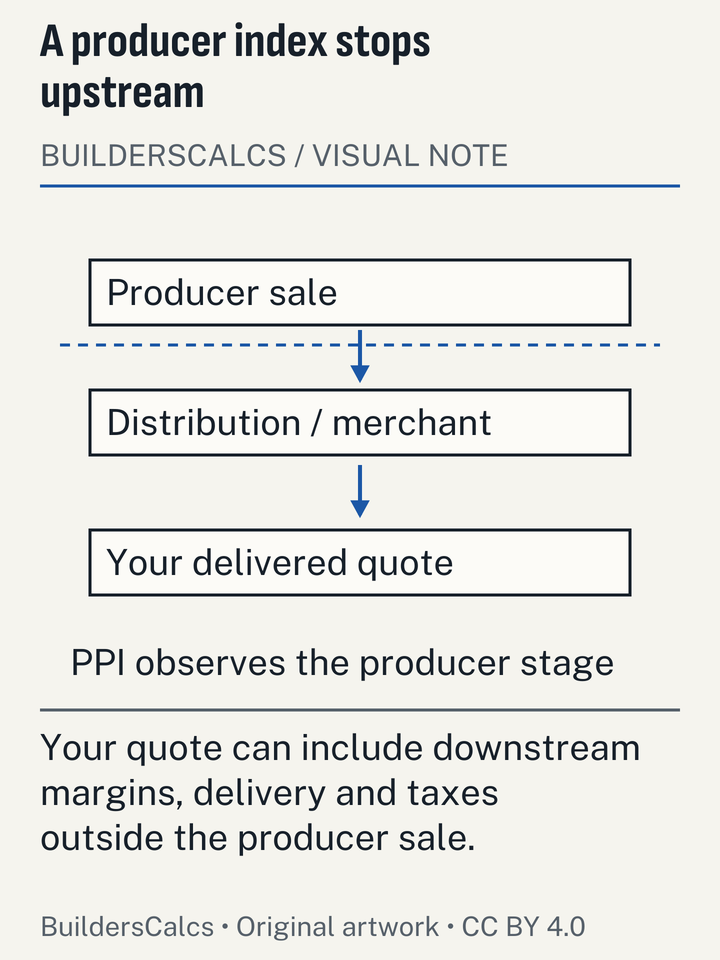
Illustration sources
How can I use this data with the calculators?
Work out quantities first, then price them locally. Our calculators give quantities only, from published coverage rates and manufacturer data: boards, sheets, bags, squares, rolls. Multiply each quantity by the price your own supplier quotes today, and use the indices on this page to judge how far that price might move before you buy.
- Drywall and finishing: the drywall calculator counts sheets, screws and joint compound.
- Insulation: the attic insulation quantity tool gives bags or rolls for a target R-value.
- Concrete: the concrete volume and bag count tool gives cubic yards, cubic metres or bags.
- Roofing: the roof squares and shingle bundles tool works from footprint and pitch.
- Decks: the board count for a new deck sizes boards, joists and screws.
The guide to building a construction estimate walks through the whole sequence: quantities, waste allowance, local prices and a contingency. To see how much US homeowners spend on these projects in total, see the DIY and remodeling spending data.
How we built this data
Sources. US figures are BLS Producer Price Index series pulled from the BLS public data API on 23 October 2026, from January 2020 to September 2026. Series titles and base dates were checked against BLS's own series catalog files. UK figures come from the Department for Business and Trade's Monthly Bulletin of Building Materials and Components, September 2026 edition, which publishes ONS producer price indices. EU figures come from Eurostat's monthly domestic producer price dataset for EU27, not seasonally adjusted.
Rebasing. BLS series use different base years. Most are 1982 = 100, and a few are 1986, 1991, 1993 or 2007. To compare them on one chart we divided each month's index by its January 2020 value and multiplied by 100. Percentage changes are within one series only. The raw index values, with their original bases, are in the CSV.
Choice of series. We picked the series closest to what a residential job buys: softwood lumber, plywood, gypsum, ready-mix, cement, block and brick, pavers, aggregates, asphalt shingles, insulation, paint, tile, rebar and steel. Two are BLS's broad 'inputs to residential construction' and 'inputs to residential maintenance and repair' bundles. BLS ended its OSB index in January 2019, so we use the reconstituted wood products industry index as a proxy. Eurostat's EU cement index stops in November 2023, so it is left out.
Corrections. While checking series titles against the BLS catalog we corrected two labels in our earlier summary table. Series WPU1311 is flat glass, not concrete block; concrete block and brick is WPU1331. Series WPU0621 is prepared paint, which is broader than the architectural coatings index (WPU062101) used on this page. The figures here use the corrected series.
Limits. These are producer prices, not retail or contractor prices, and they say nothing about regional differences within a country. The broad bundles are weighted by BLS and include goods, such as fixtures and appliances, that our calculators do not cover. UK monthly tables by type of work begin in January 2021, so the UK window is a year shorter than the US one. EU indices describe industries, not single products.
How to cite this page
The tables, charts and CSV on this page are licensed under Creative Commons Attribution 4.0 (CC BY 4.0). Credit BuildersCalcs and link to this page. The citation box at the end of the page copies a full reference in one click.
When you quote a change, keep three things with it: the material, the two months being compared, and whether the latest month is preliminary. A short form that works in most articles: 'US producer prices for softwood lumber were 30.5% higher in September 2026 (preliminary) than in January 2020 (BuildersCalcs analysis of BLS PPI data)'. Please name BLS, DBT or Eurostat as the underlying source as well. Our part is the selection of series, the rebasing to January 2020 and the side-by-side presentation.
Download the data and charts
One row per month, series and region, with the index value, its base, the publisher and whether the value is final, preliminary or provisional. The charts are 1200 by 750 pixel PNGs under the same licence.
- CSVBuilding material producer price indices, US, UK and EU27, 2020–2026 (CSV)
- PNGChart: US building material prices, January 2020 = 100 (PNG)
- PNGChart: 12-month change in US building material prices (PNG)
Questions about building material prices
Are lumber prices higher now than in 2020?
Yes, against January 2020: softwood lumber producer prices were 30.5% higher in September 2026. Against the 2020 annual average, which includes the late-2020 surge, the rise is small. Both are correct; they use different starting points.
Why do the latest months change after I quote them?
BLS treats the latest four months of each producer price index as preliminary and revises them as late reports come in. The revisions are usually small, but quote the month and the word 'preliminary' so readers know the figure may move.
How often is this tracker updated?
It is updated when new data is released. BLS publishes producer price indices monthly, DBT publishes its building materials bulletin monthly, and Eurostat updates its dataset monthly. The date at the top of the page shows the last update.
Can I compare the UK index level with the US index level?
No. The UK series use 2015 = 100 and the US series on our chart use January 2020 = 100, and the two baskets are built differently. Compare percentage changes over the same months, not index levels.
Why is there no OSB price index?
BLS stopped publishing its OSB and waferboard index in January 2019. We show the index for reconstituted wood product mills instead, which covers OSB along with particleboard and fiberboard. Treat it as a proxy for OSB, not a direct measure.
Cite this page
You may reuse the figures and downloads on this page under CC BY 4.0. Please credit BuildersCalcs with a link to this page.
Sources (8)
- Eurostat
- Construction producer prices or costs, new residential buildings - quarterly data (sts_copi_q), checked
- Producer prices in industry, domestic market - monthly data (sts_inppd_m), checked
- Joint Center for Housing Studies of Harvard University
- Improving America's Housing 2025, checked
- UK Department for Business and Trade
- Construction building materials: tables September 2026, checked
- Monthly Bulletin of Building Materials and Components, September 2026 (no. 617), Tables 1a, 2 and 3, checked
- US Bureau of Labor Statistics
- PPI series catalog files wp.series and pc.series (official series titles and index base dates), checked
- Producer Price Index by commodity (series WPU0811, WPU083, WPU137, WPU1322, WPU1333, WPU1321, WPU1342, WPU1344, WPU1361, WPU1392, WPU0621, WPU1231, WPU1232, WPUIP2321001), checked
- Producer Price Index monthly data, series WPUIP2311001, WPUIP2321001, WPU0811, WPU083, WPU0831, PCU321219321219, WPU137, WPU13710102, WPU1333, WPU1322, WPU1331, WPU13314101, WPU1342, WPU1321, WPU1361, WPU1392, WPU13920105, WPU062101, WPU1344, WPU1017, WPU1074051 (Jan 2020-September 2026), checked
Every number on this page is taken from these documents. How we choose and check sources.