

Concrete and cement statistics: production, consumption, CO2 and recycling in the US, UK and EU (2021–2025)
The US used an estimated 110 million metric tons of cement in 2025 and produced 84 million metric tons, according to the U.S. Geological Survey's Mineral Commodity Summaries 2026. Most of that cement ends up in ready-mixed concrete, of which US plants produced 379.1 million cubic yards in 2024 by the National Ready Mixed Concrete Association's estimate. This page brings together US, Great Britain and EU figures for cement, ready-mix, aggregates, blocks and bricks, with the CO2 from cement making and what happens to old concrete.
110million metric tons
of cement used in the US in 2025 (USGS estimate), unchanged from 2024
(U.S. Geological Survey (USGS), National Minerals Information Center)
379.1million cubic yards
of ready-mixed concrete produced in the US in 2024, down on 2023 (NRMCA)
1.5billion metric tons
of crushed stone produced in the US in 2025, most of it used as construction aggregate
(U.S. Geological Survey (USGS), National Minerals Information Center)
405.2million US tons
of concrete in US construction and demolition debris in 2018, the largest single material (EPA's latest estimate)
(US Environmental Protection Agency (EPA), Office of Resource Conservation and Recovery)
What are the main findings?
- US cement use is flat: USGS estimates US apparent cement consumption at 110 million metric tons in 2025, unchanged from 2024 and down from 114 million in 2022 (Mineral Commodity Summaries 2026).
- The US makes less cement than it uses: production was 84 million metric tons in 2025, with imports covering the gap.
- Ready-mix fell in 2024 and early 2025: NRMCA estimates US ready-mixed concrete production at 379,149,000 cubic yards (289.9 million cubic meters) in 2024, down about 5% from 400,024,000 cubic yards in 2023. US ready-mixed concrete production for January-June 2025 was 172.8 million cubic yards, 5.3% below the same period of 2024, per NRMCA's monthly production sheet.
- Portland-limestone cement has taken over: Blended cement made up 63% of US cement shipments in the first nine months of 2025, and about 95% of that blended cement was portland-limestone cement (Type IL), per USGS MCS 2026.
- Great Britain is pouring less concrete: Great Britain ready-mixed concrete deliveries were 11.03 million cubic meters (about 14.4 million cubic yards at 1.308 yd3 per m3) in 2025, down from 15.33 million in 2021, per DBT's September 2026 building materials bulletin.
- Most old US concrete is reused: In 2018, 301.2 million US tons of C&D concrete were sent to aggregate reuse and 71.2 million tons to landfill, per EPA's latest C&D estimate.
- Cement making is a large CO2 source: Global process CO2 from cement clinker production was about 1.5 billion tonnes in 2024, plus about 0.9 billion tonnes from fuel burned for kiln heat, per CICERO's Global Carbon Project cement dataset (Oct 2025).
US figures for 2025 are USGS estimates made before the year's data were complete, and NRMCA's ready-mix totals are modelled from cement shipments. Both are revised later. The GB figures are delivery and sales counts from the Department for Business and Trade.
How much cement does the US produce and use each year?
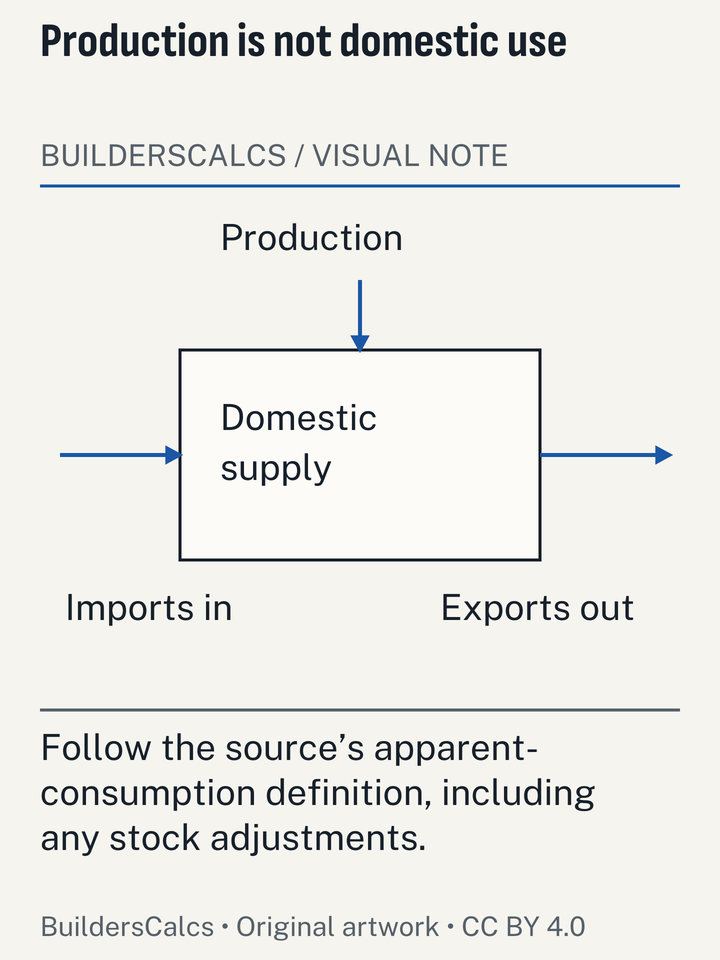
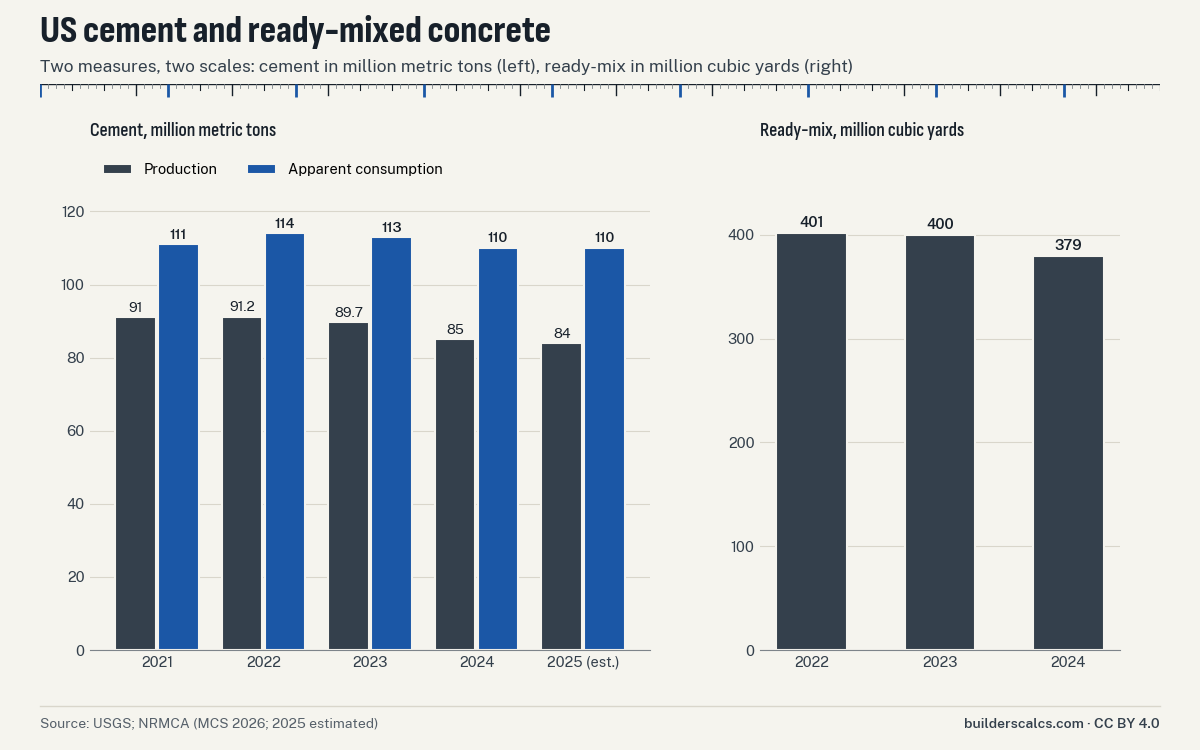
US portland, blended and masonry cement production was an estimated 84 million metric tons in 2025 from 97 plants in 34 states and Puerto Rico, down from 91 million in 2021 (USGS MCS 2026). Consumption is higher. USGS estimates US apparent cement consumption at 110 million metric tons in 2025, unchanged from 2024 and down from 114 million in 2022 (Mineral Commodity Summaries 2026). 'Apparent consumption' is USGS's term for production plus imports minus exports, adjusted for stock changes.
Both series peaked in 2022 in the five years shown and have eased since, while the average mill value of cement rose every year to 2024 and then held. The table gives the full USGS series, including the aggregates, lime and gypsum wallboard that go into the same building work.
| Series | Unit | 2021 | 2022 | 2023 | 2024 | 2025 (est.) |
|---|---|---|---|---|---|---|
| Cement production (portland, blended, masonry) | thousand t | 91,000 | 91,200 | 89,700 | 85,000 | 84,000 |
| Cement apparent consumption | thousand t | 111,000 | 114,000 | 113,000 | 110,000 | 110,000 |
| Cement average mill value | USD/t | 127 | 139 | 152 | 160 | 160 |
| Crushed stone sold or used | million t | 1,510 | 1,540 | 1,550 | 1,500 | 1,500 |
| Crushed stone average unit value | USD/t | 13.26 | 14.31 | 15.86 | 17.5 | 18.5 |
| Construction sand and gravel sold or used | million t | 939 | 959 | 967 | 880 | 870 |
| Construction sand and gravel average unit value | USD/t | 10.52 | 11.35 | 12.54 | 13.9 | 14.5 |
| Lime production | thousand t | 16,600 | 16,700 | 15,800 | 15,000 | 15,000 |
| Hydrated lime average value | USD/t | 158 | 179.1 | 234.6 | 274.2 | 280 |
| Gypsum wallboard products sold | million sq ft | 27,300 | 28,200 | 27,000 | 27,200 | 26,000 |
Where does US cement go?
Mostly into ready-mixed concrete. An estimated 70% to 75% of US cement sales in 2025 went to ready-mixed concrete producers (USGS), and NRMCA's production model assumes 75% of shipped cement goes to ready mix. The rest goes into concrete products such as block, pipe and precast, into contractors' site-mixed concrete and into bagged mixes.
The type of cement has changed fast. Blended cement made up 63% of US cement shipments in the first nine months of 2025, and about 95% of that blended cement was portland-limestone cement (Type IL), per USGS MCS 2026. Portland-limestone cement replaces part of the clinker with ground limestone, which cuts the CO2 per ton. For a DIY slab or post, the change is invisible: bagged mixes are sold by strength and yield, not cement type. The concrete mix ratio chart explains how those mixes compare.
How much ready-mixed concrete is produced in the US?
NRMCA estimates US ready-mixed concrete production at 379,149,000 cubic yards (289.9 million cubic meters) in 2024, down about 5% from 400,024,000 cubic yards in 2023. The early 2025 figures point to a further fall. US ready-mixed concrete production for January-June 2025 was 172.8 million cubic yards, 5.3% below the same period of 2024, per NRMCA's monthly production sheet.
Production is concentrated in large, fast-growing states. Texas alone produced more ready-mix in 2024 than California and Florida together, and every leading state produced less than in 2023. The chart and table show the leading states.
Which states produce the most ready-mixed concrete?
Texas leads by a wide margin, followed by California and Florida. Every state in the list produced less ready-mix in 2024 than in 2023.
| State | Cubic yards | Share of US | Change on 2023 |
|---|---|---|---|
| Texas | 67,124,000 | 17.7% | -3.9% |
| California | 33,138,000 | 8.7% | -3.6% |
| Florida | 31,232,000 | 8.2% | -3.0% |
| Georgia | 12,267,000 | 3.2% | -14.9% |
| Ohio | 11,847,000 | 3.1% | -5.0% |
| Arizona | 11,550,000 | 3.0% | -8.2% |
| North Carolina | 11,171,000 | 2.9% | -9.2% |
| New York | 10,594,000 | 2.8% | -5.9% |
| Year | Cubic yards | Cubic metres |
|---|---|---|
| 2022 | 401,434,000 | None |
| 2023 | 400,024,000 | 305,858,000 |
| 2024 | 379,149,000 | 289,898,000 |
How much crushed stone, sand and gravel does the US produce?
Aggregates are by far the largest mineral product by tonnage. USGS estimates 1.5 billion metric tons of crushed stone worth $27 billion was produced in the US in 2025 at 3,500 quarries, with 72% used as construction aggregate, mostly for roads. USGS estimates 870 million metric tons of construction sand and gravel worth $12.6 billion was produced in the US in 2025, with 42% used as portland cement concrete aggregate and 20% for road base.
Prices have risen faster than volumes. The average unit value of crushed stone was 18.5 USD per metric ton in 2025, against 280 USD per metric ton for hydrated lime, the lime used in mortar. Both are plant values, not the price a homeowner pays for a delivered load, which adds haulage and the yard's margin.
Aggregate is sold by the ton but measured on site by the cubic yard. The weight of gravel, sand and soil per yard table converts between the two, by stone type and condition.
How much concrete is used in Great Britain?
Less each year since 2021. Great Britain ready-mixed concrete deliveries were 11.03 million cubic meters (about 14.4 million cubic yards at 1.308 yd3 per m3) in 2025, down from 15.33 million in 2021, per DBT's September 2026 building materials bulletin. Great Britain sales of sand and gravel fell to 40.97 million tonnes in 2025 from 53.77 million in 2021, with 17.09 million tonnes sold as sand for concreting, per DBT Table 4b.
Blocks and bricks follow the same pattern, with a small recovery for bricks in 2025. Great Britain concrete block deliveries were 54.2 million square meters in 2025 (dense 18.4, lightweight 13.8, aerated 22.1), down from 73.4 million in 2021, per DBT Table 11c. Great Britain brick deliveries were 1,481 million bricks in 2025, up from 1,401 million in 2024 but below 2,050 million in 2018, per DBT Table 9c.
Housebuilding is a large part of the market. UK housebuilding accounted for 29% of ready-mixed concrete demand and 23% of aggregates demand in 2024, per the MPA Profile 2025. The UK also relies more on imported cement than before. Imports supplied a record 32% of UK domestic cement sales and 58% of domestic cement sales went into ready-mixed concrete in 2024, per the MPA Profile 2025. Recycled material makes up a large part of aggregate supply. MPA estimates 74.7 million tonnes of recycled and secondary aggregates were used in Great Britain in 2024, just under a third of total construction aggregates supply.
| Series | Unit | 2021 | 2022 | 2023 | 2024 | 2025 |
|---|---|---|---|---|---|---|
| Ready-mixed concrete deliveries | thousand m3 | 15,329 | 14,752 | 13,837 | 12,259 | 11,026 |
| Total sand and gravel sales | thousand t | 53,767 | 53,266 | 45,568 | 41,936 | 40,965 |
| Sand for concreting | thousand t | 21,671 | 21,899 | 18,145 | 16,084 | 17,092 |
| Gravel for concreting and other uses | thousand t | 21,382 | 20,557 | 17,969 | 15,786 | 14,643 |
| Concrete block deliveries | thousand m2 | 73,423 | 71,305 | 55,776 | 55,484 | 54,235 |
| Brick deliveries | million bricks | 1,935.6 | 1,936.4 | 1,371.7 | 1,401.3 | 1,480.9 |
| Cement production (UK) | thousand t | 9,008 | 8,393 | 7,689 | 7,283 | 6,934 |
How much cement does the EU produce?
EU27 cement production was 160.8 million tonnes in 2024 (down 0.2%) while EU27 consumption fell to 148.1 million tonnes, per Cement Europe's 2025 Activity Report. EU production is larger than its consumption, so the EU makes more cement than it uses, while the UK relies on imports for a record share of its sales. The EU figures come from Cement Europe, the industry body formerly called CEMBUREAU, and are for 2024. The 2025 figures were not yet published when we compiled this page.
How much CO2 does cement production emit?
Making cement releases CO2 in two ways: from heating limestone, which gives off CO2 as it turns into clinker, and from the fuel burned to heat the kiln. Global process CO2 from cement clinker production was about 1.5 billion tonnes in 2024, plus about 0.9 billion tonnes from fuel burned for kiln heat, per CICERO's Global Carbon Project cement dataset (Oct 2025).
US emissions are a small part of the global total. Process CO2 from US cement production was 37.2 million metric tons CO2e in 2024, 8% below 2023 and 11% above 1990, per the University of Maryland's continuation of the US GHG inventory (2026). China and India account for most of the world's cement CO2, as the table shows. India's emissions grew strongly between 2015 and 2024, while China's fell.
| Country | 2015 (kt CO2) | 2024 (kt CO2) |
|---|---|---|
| China (mainland) | 706,300 | 617,800 |
| India | 117,500 | 186,000 |
| United States | 39,910 | 37,270 |
| United Kingdom | 4,393 | 3,624 |
How much old concrete is recycled?
Most of it, in the US. Concrete made up 405.2 million US tons (67.5%) of the 600 million tons of US construction and demolition debris in 2018, with 381 million tons from demolition; 2018 is still EPA's latest C&D estimate. In 2018, 301.2 million US tons of C&D concrete were sent to aggregate reuse and 71.2 million tons to landfill, per EPA's latest C&D estimate. Crushed concrete goes back into road base, fill and new aggregate.
A common belief is that concrete waste comes mainly from over-ordering on building sites. EPA's figures show the reverse: almost all C&D concrete comes from demolition, and only a small part is waste during construction. That said, ordering the right amount still matters to the person paying for the pour. The full picture for other materials is on the construction waste by material page.
| Measure | Million US tons |
|---|---|
| Generated during construction | 24.2 |
| Generated by demolition | 381 |
| Total generated | 405.2 |
| Sent to aggregate | 301.2 |
| Sent to manufactured products | 32.8 |
| Landfilled | 71.2 |
How many workers are exposed to silica dust from concrete?
Cutting, grinding and drilling concrete, block, brick and stone releases respirable crystalline silica. OSHA estimated its 2016 respirable crystalline silica rule affects 2.3 million US workers, 2.0 million of them in construction; this remains the rule's official estimate. OSHA's construction silica standard caps respirable crystalline silica at 50 micrograms per cubic meter as an 8-hour TWA, with an action level of 25 (29 CFR 1926.1153, current eCFR).
OSHA's Table 1 lists controls for common tasks. For saws, the answer is nearly always water fed to the blade, with a respirator added for longer or indoor work, as the table shows.
| Equipment | Control | Respirator, 4 hours or less | Respirator, over 4 hours |
|---|---|---|---|
| Stationary masonry saw | Integrated water feed to blade | None | None |
| Handheld power saw, outdoors | Integrated water feed to blade | None | APF 10 |
| Handheld power saw, indoors or enclosed | Integrated water feed to blade | APF 10 | APF 10 |
| Handheld saw for fiber-cement board (8 in blade or less), outdoors | Dust collection with 99%+ filter | None | None |
| Walk-behind saw, outdoors | Integrated water feed to blade | None | None |
| Walk-behind saw, indoors or enclosed | Integrated water feed to blade | APF 10 | APF 10 |
How do I work out the concrete for my own job?
National totals are measured in millions of yards. A garden slab is measured in fractions of one. These tools work from published bag yields and code minimums:
- The concrete calculator gives cubic yards, cubic metres and bags for slabs, footings and columns.
- The concrete calculation method guide works the same sums by hand.
- The CMU blocks per wall tool counts blocks from wall size.
- The mortar for brick or block joints tool turns that count into bags of mortar mix.
For the job site, the concrete bag chart in our free PDF reference charts gives bags per cubic yard and cubic metre for each bag size on one sheet.
How we built this data
Sources. US cement, aggregates, lime and wallboard figures are from the U.S. Geological Survey's Mineral Commodity Summaries 2026. Ready-mix production is from NRMCA's annual and monthly estimates. Great Britain figures are from the Department for Business and Trade's Building Materials and Components Statistics (September 2026 bulletin), which draws on ONS and Mineral Products Association data, and from the MPA Profile 2025. EU figures are from Cement Europe's 2025 Activity Report. CO2 figures are from the Global Carbon Project cement dataset (CICERO, October 2025) and the University of Maryland's continuation of the US greenhouse gas inventory. C&D concrete is from EPA's Facts and Figures. Silica figures are from OSHA's 2016 final rule and the current eCFR. All were read in October 2026.
Method. We recorded each figure in its published unit and did not convert or adjust it, apart from the cubic-metre conversion stated in the GB ready-mix fact. The chart is drawn from the USGS and NRMCA tables shown here.
Limits. USGS figures for the latest year are estimates and are revised the following year. NRMCA's ready-mix totals are modelled from cement shipments, not counted from every plant. US, GB and EU figures use different definitions, units and years, so compare trends within each source rather than levels across them. EPA's 2018 C&D estimate is the latest of its kind. We could not find a public figure for the residential share of US concrete use, so it is not included.
How to cite this page
You can reuse the figures, chart and tables on this page under the Creative Commons Attribution 4.0 licence (CC BY 4.0). Credit BuildersCalcs and link to this page. The citation line in the box at the end of the page copies with one click.
Please keep the year and the source with each figure, and mark USGS's latest year as an estimate. A short form that works in most articles: 'the US used an estimated 110 million metric tons of cement in 2025 (USGS, compiled by BuildersCalcs)'. Our part is the selection, the chart and putting the US, GB and EU series side by side. The figures belong to the agencies and associations named.
Download the chart
The cement and ready-mix chart as a PNG image, free to reuse under CC BY 4.0 with a credit link to this page.
- CSVConcrete, cement and aggregates tables (CSV)
- PNGUS cement production and consumption, and ready-mixed concrete production (PNG)
Questions about concrete and cement figures
What is the difference between cement and concrete?
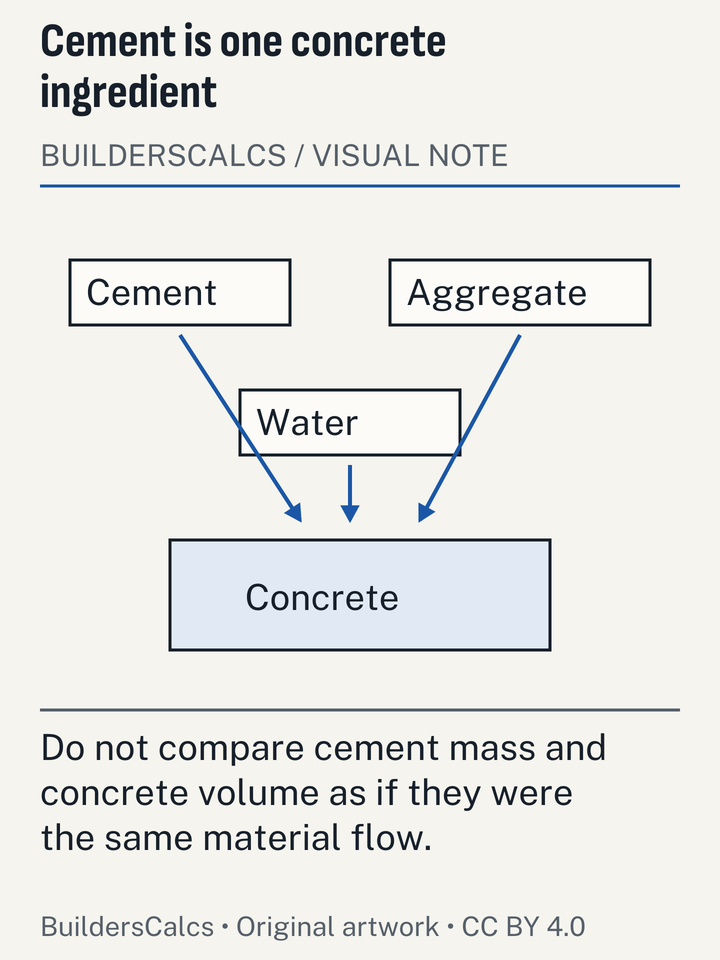
Cement is the grey powder that binds concrete together. Concrete is cement mixed with sand, gravel or crushed stone and water. Cement is only a minority of the mix by weight, which is why aggregate tonnages are far larger than cement tonnages.
Why does the US use more cement than it makes?
Domestic plants do not cover demand, so the difference is imported. USGS reports production of 84 million metric tons against consumption of 110 million metric tons in 2025.
Is Type IL cement weaker than ordinary portland cement?
Not as sold. Bagged mixes and ready-mix are specified by strength, and producers adjust the mix to meet it. The switch to portland-limestone cement changes the CO2 per ton, not the strength you order.
Are these figures updated?
Yes. USGS publishes new Mineral Commodity Summaries each January, NRMCA and the MPA publish annually, and DBT publishes monthly. We update this page when those releases come out and change the date at the top.
Cite this page
You may reuse the figures and downloads on this page under CC BY 4.0. Please credit BuildersCalcs with a link to this page.
Sources (16)
- CICERO Center for International Climate Research (Robbie M. Andrew), via Zenodo
- Global CO2 emissions from cement production, version 251007 (GCP-CEM.csv, 1880-2024), checked
- Cement Europe (formerly CEMBUREAU, the European Cement Association)
- Cement Europe Activity Report 2025, checked
- Center for Global Sustainability, University of Maryland (Hedger, Camobreco, Desai, Steller)
- Greenhouse Gas Inventory and Analysis for the United States: 1990-2024, Chapter 4 Industrial Processes and Product Use (doi:10.13016/g1xw-qftw), checked
- Department for Business and Trade (DBT), UK (data from ONS, DBT and Mineral Products Association)
- Monthly Bulletin of Building Materials and Components, September 2026 (Bulletin 617), data tables, checked
- Mineral Products Association (MPA), UK
- Profile of the UK Mineral Products Industry, 2025 Edition, checked
- National Ready Mixed Concrete Association (NRMCA)
- U.S. Ready Mixed Concrete Production industry fact sheet, 2024 edition (2023 production by state; 2022 total), checked
- U.S. Ready Mixed Concrete Production industry fact sheet, 2025 edition (monthly sheet and 2024 production by state), checked
- Occupational Safety and Health Administration (OSHA), Federal Register (GovInfo)
- Occupational Exposure to Respirable Crystalline Silica; Final Rule, 81 FR 16286 (March 25, 2016), checked
- Office of the Federal Register / OSHA (eCFR)
- 29 CFR 1926.1153 Respirable crystalline silica (construction), including Table 1, checked
- The Quikrete Companies
- Safety Data Sheet C1: Portland Cement Based Concrete Products (rev. Feb-23), checked
- U.S. Geological Survey (USGS), National Minerals Information Center
- Mineral Commodity Summaries 2026 (full volume; Sand and Gravel (Construction) chapter), checked
- Mineral Commodity Summaries 2026: Cement, checked
- Mineral Commodity Summaries 2026: Gypsum, checked
- Mineral Commodity Summaries 2026: Lime, checked
- Mineral Commodity Summaries 2026: Stone (Crushed), checked
- US Environmental Protection Agency (EPA), Office of Resource Conservation and Recovery
- Advancing Sustainable Materials Management: 2018 Fact Sheet, checked
Every number on this page is taken from these documents. How we choose and check sources.