

Construction waste statistics: debris by material, landfill share and site waste rates (US, UK, EU)
The United States generated an estimated 600 million tons of construction and demolition debris in 2018, the latest year the Environmental Protection Agency has published. Only 33 million tons of that came from waste during construction; the rest was demolition. This page brings together EPA figures by material, England's recovery rate from Defra, the EU's share from Eurostat, and published site waste rates from RICS and the Mineral Products Association. It sets those next to the ordering allowances manufacturers give for each material.
600million US tons
of construction and demolition debris generated in the US in 2018, more than twice the municipal solid waste total
3.9million US tons
of drywall and plaster wasted during US construction in 2018, second only to concrete
(US Environmental Protection Agency (EPA), Office of Resource Conservation and Recovery)
95.3% recovered
of England's non-hazardous construction and demolition waste in 2024 (provisional)
38.4% of EU waste
came from construction in 2022, more than any other economic activity
What are the main findings?
- Demolition, not building, makes most of the debris: of 600 million tons of US C&D debris in 2018, only 33 million tons was waste during construction.
- Drywall is the largest construction-phase waste after concrete: 3.9 million tons in 2018, ahead of wood at 3.4 million tons.
- Concrete is mostly reused; drywall, shingles and brick mostly are not: 334 million tons of US C&D concrete went to a next use, while most drywall (13.2 million tons landfilled) and most shingles went to landfill.
- About a quarter of US C&D debris is landfilled: 143.8 million tons in 2018.
- England recovers almost all of its non-hazardous C&D waste: 95.3% in 2024, a little higher each year since 2010.
- Published site waste rates are small for most materials: RICS sets 4% for plasterboard, and a 2023 MPA study proposed 5% for concrete blocks, well below the old WRAP baseline.
The US figures are for 2018 because EPA has not published a newer construction and demolition estimate. They are the latest of their kind, not current-year counts. Please give the year with any figure you quote.
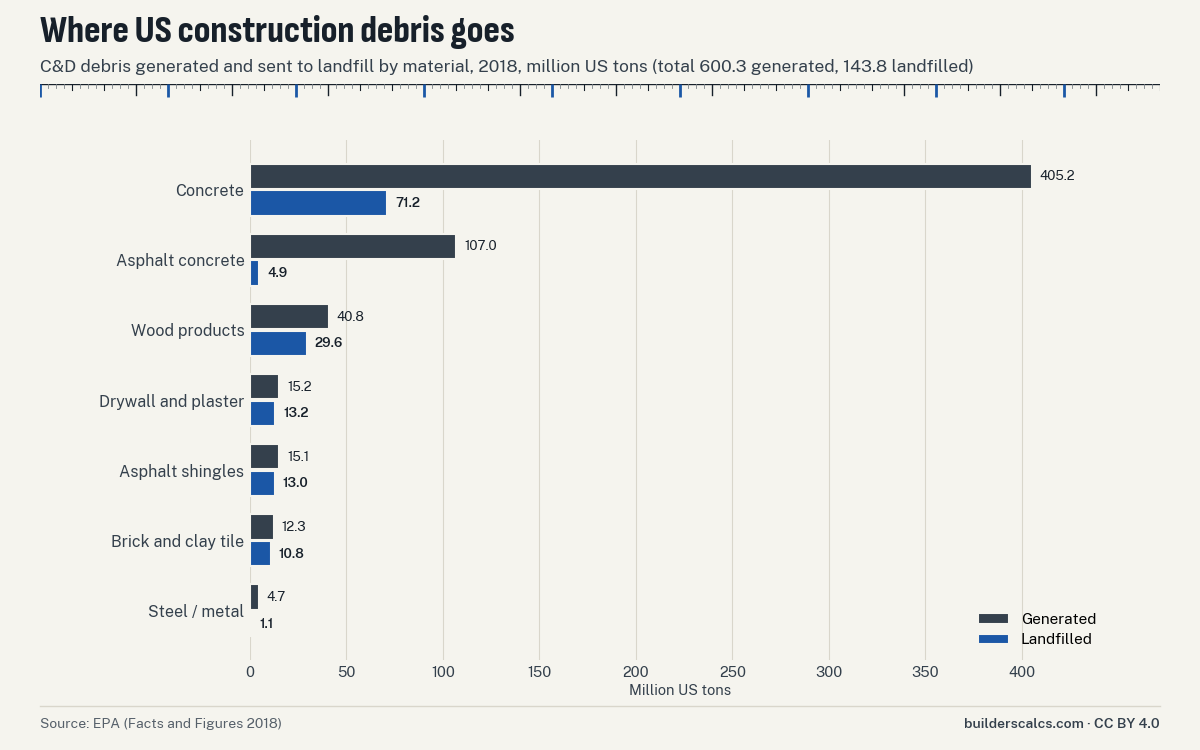
How much construction and demolition waste does the US produce?
The US produced about 600 million tons of construction and demolition (C&D) debris in 2018, according to EPA. EPA estimates 600 million US tons of construction and demolition debris were generated in the United States in 2018, more than twice the municipal solid waste total; 2018 remains EPA's latest C&D estimate. EPA counts a defined set of materials: concrete, asphalt concrete, wood, drywall and plaster, asphalt shingles, brick and clay tile, and steel. Other site waste, such as packaging, plastics and insulation offcuts, is not in the total.
Most of the tonnage is heavy mineral material from demolition and road work. Concrete alone made up most of the total, and asphalt concrete from roads a large part of the rest. Materials a homeowner orders by the sheet or bundle are a far smaller share by weight, but they are the ones least likely to be reused.
| Material | Waste during construction | Demolition debris | Total generated | Landfilled | Next use (recycled, reused, fuel) |
|---|---|---|---|---|---|
| Concrete | 24.2 | 381 | 405.2 | 71.2 | 334 |
| Wood products | 3.4 | 37.4 | 40.8 | 29.6 | 11.2 |
| Drywall and plaster | 3.9 | 11.3 | 15.2 | 13.2 | 2.1 |
| Steel / metal | 0 | 4.7 | 4.7 | 1.1 | 3.6 |
| Brick and clay tile | 0.3 | 12 | 12.3 | 10.8 | 1.5 |
| Asphalt shingles | 1.2 | 13.9 | 15.1 | 13 | 2.1 |
| Asphalt concrete | 0 | 107 | 107 | 4.9 | 102.1 |
| Total | 33 | 567.3 | 600.3 | 143.8 | 456.6 |
Does most construction waste come from building new homes?
No. Most C&D debris comes from tearing structures down, not from putting them up. Of the 600.3 million tons of US C&D debris in 2018, only 33.0 million tons came from waste during construction and 567.3 million tons from demolition, per EPA. Demolition accounts for the overwhelming majority of the tonnage.
New building still produces waste per home. EPA's most recent per-area figure is old. EPA's characterization of building-related C&D debris put the weighted average waste from new US residential construction at 4.38 pounds per square foot of floor area (1996 data); no newer national EPA per-square-foot figure has been published. It is the latest national figure of its kind, so treat it as a historical benchmark rather than a current rate. The spread between sites was wide. Site waste audits of 93 new US dwelling units summarized by EPA ranged from 2.41 to 11.3 pounds of debris per square foot, a spread EPA attributes to house type and builder practice rather than geography.
That spread matters more to a builder than the average does. Two builders putting up similar houses produced very different amounts of debris, and EPA put the difference down to practice. Accurate take-offs, sensible sheet and board sizes, and reuse of offcuts are the parts a builder controls.
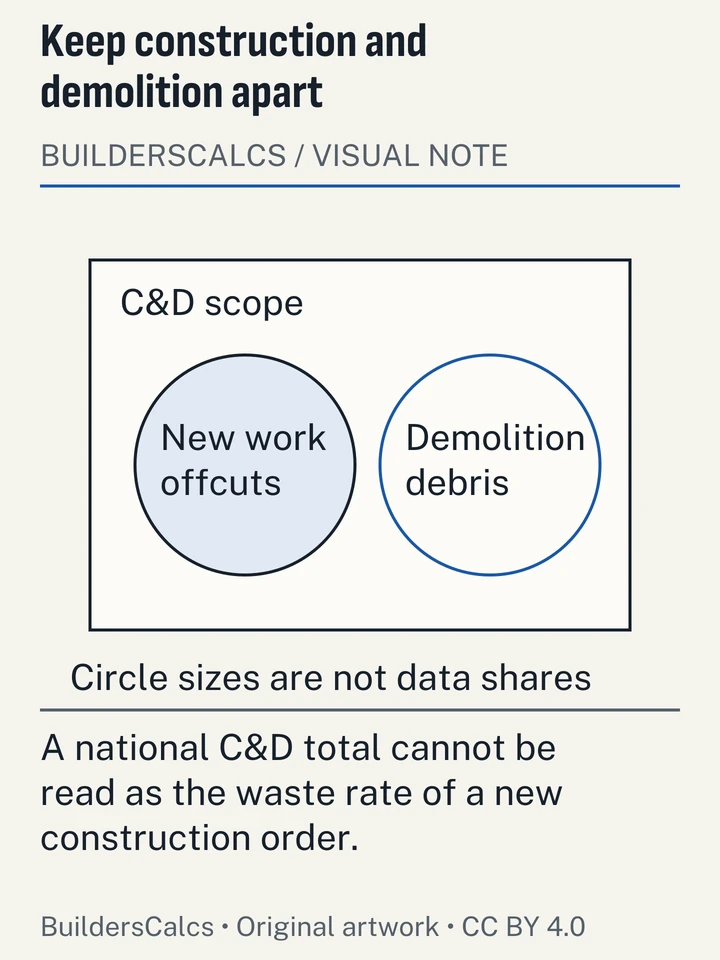
Illustration sources
- US Environmental Protection Agency (EPA), Office of Resource Conservation and Recovery — Advancing Sustainable Materials Management: 2018 Fact Sheet
- US EPA (prepared by Franklin Associates), EPA530-R-98-010 — Characterization of Building-Related Construction and Demolition Debris in the United States
- US EPA — Construction and Demolition Debris: Material-Specific Data
How much drywall waste goes to landfill?
Most of it. In 2018, 13.2 million tons of US C&D gypsum drywall went to landfill and only 2.1 million tons to a next use, so roughly 86% was landfilled (EPA). Drywall is also the largest construction-phase waste stream after concrete. EPA estimates 3.9 million tons of drywall and plaster were wasted during US construction in 2018, more than any other material except concrete (24.2 million tons). Offcuts from cutting sheets to fit walls, openings and ceilings make up much of it.
Better planning can cut drywall waste on site. In England, Defra's plasterboard action plan recorded one contractor halving its waste. Defra's 2010 Plasterboard Sustainability Action Plan reports a Kier site at Carmel College, St Helens, halving plasterboard waste from 10% to 5% by cutting over-ordering and reusing offcuts; the plan set a 15% maximum wastage target for 2010. RICS now uses a much lower default for carbon accounting. The RICS whole life carbon standard (2nd edition, 2023) sets a default UK site waste rate of 4% for plasterboard, 6% for clay brickwork and 6% for tile floor finishes.
These figures differ because they measure different things: one case-study site, a 2010 sector target, and a default for carbon calculations. None of them is a national measured average. The drywall sheets, screws and mud tool counts sheets from the wall and ceiling areas, so the order matches the job rather than a rough guess.
What happens to wood, shingles and brick waste?
Wood is partly recovered; shingles and brick mostly are not. In 2018, 29.6 million tons of US C&D wood were landfilled while 11.2 million tons went to fuel, mulch or products, about 73% landfilled (EPA). EPA estimates 3.4 million tons of wood products were wasted during US construction in 2018, out of 40.8 million tons of wood in all C&D debris.
Asphalt shingles arrive in landfill mainly from tear-offs. In 2018, 13.0 million tons of US C&D asphalt shingles were landfilled versus 2.1 million tons sent to a next use, about 86% landfilled (EPA). Waste from installing new shingles is a small part. EPA estimates 1.2 million tons of asphalt shingles were wasted during US construction in 2018, against 13.9 million tons from demolition and tear-off. The roof area from footprint and pitch tool works out squares and bundles before any trim allowance is added.
Brick and clay tile are heavy and rarely reused. In 2018, 10.8 million tons of US C&D brick and clay tile went to landfill and 1.5 million tons to aggregate, about 88% landfilled (EPA). Concrete is the exception among mineral materials. In 2018, 334.0 million tons of US C&D concrete went to a next use (301.2 million tons as aggregate) and 71.2 million tons to landfill, per EPA. Crushed concrete is widely used as aggregate, which is why its landfill share is much lower than brick's.
How much carpet and paint is thrown away?
Carpet is a large household waste stream that EPA counts under municipal waste rather than C&D debris. Of 3.37 million tons of carpets and rugs entering US municipal waste in 2018, 2.46 million tons were landfilled and 310,000 tons recycled, EPA's latest national Facts and Figures data. State programs show what recovery can reach. California's carpet stewardship program recycled 38.5% of post-consumer carpet in 2024, a record, from 194.6 million lb discarded, while 117.9 million lb still went to landfill (CARE 2024 Annual Report).
Leftover paint is harder to measure. Oregon's stewardship program gives one of the few published figures. Oregon's PaintCare program collected 649,346 gallons of leftover paint in 2024, equal to 7.7% of the 8.4 million gallons of new architectural paint sold that year. That is paint brought back for recovery in one state, not the total amount left over. Both figures come from single programs, so they are not national rates.
How much construction waste does England recover?
England recovers almost all of its non-hazardous construction and demolition waste, according to Defra. England recovered 60.3 million of the 63.3 million tonnes of non-hazardous construction and demolition waste it generated in 2024, a 95.3% recovery rate (Defra, provisional). Recovery here means the waste did not go to landfill: Defra calculates it as generation minus landfill, and it does not separate reuse from recycling or backfilling.
Construction dominates England's waste overall. Construction, demolition and excavation generated 118.2 million of England's 178.1 million tonnes of waste in 2024, about 66% of the total (Defra, provisional). That total includes excavation, mostly soil and stone, which the recovery rate above leaves out. The table shows the trend. Recovery has risen slowly but steadily since 2010, and the 2024 figure is provisional.
| Year | Generated (million tonnes) | Recovered (million tonnes) | Recovery rate (%) |
|---|---|---|---|
| 2010 | 53.6 | 49.4 | 92.2 |
| 2012 | 50.5 | 46.4 | 92 |
| 2014 | 55.9 | 51.7 | 92.4 |
| 2016 | 59.6 | 55 | 92.1 |
| 2018 | 61.4 | 57.5 | 93.8 |
| 2020 | 53.9 | 50.3 | 93.2 |
| 2021 | 61.1 | 57.2 | 93.6 |
| 2022 | 63 | 59.4 | 94.3 |
| 2023 | 63.5 | 60.2 | 94.8 |
| 2024 (provisional) | 63.3 | 60.3 | 95.3 |
How much waste does EU construction produce?
Construction is the largest source of waste in the EU. Construction generated 38.4% of all waste in the EU in 2022, the largest share of any economic activity, according to Eurostat. EU construction activities (NACE F) generated 862.2 million tonnes of waste in 2022, out of 2,225.7 million tonnes from all activities and households, per Eurostat's env_wasgen dataset.
Two Eurostat releases give slightly different shares for the same year, because the dataset has been revised since Eurostat's summary article was written. We quote the published share and the current tonnage from the live dataset. Like the England total, the EU figure includes excavated soil, so it is not comparable with EPA's US total, which leaves soil out.
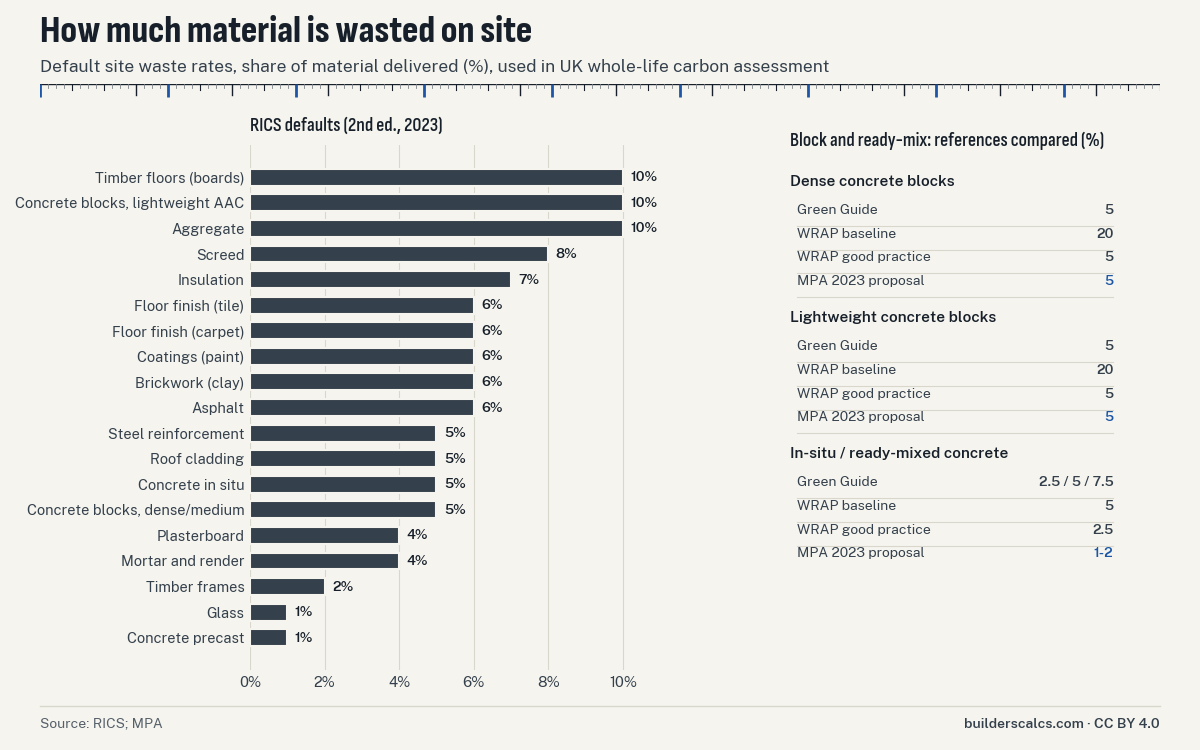
What percentage of materials is wasted on site?
For most materials, published site waste rates are a small share of what is delivered, in single figures. The most complete current list comes from RICS, the UK surveyors' body. RICS (2023) gives a default site waste rate of 10% for timber floor boards and aggregate, against 2% for structural timber frames and 1% for glass. RICS gives these rates as defaults for whole-life carbon assessments, to be replaced with project data where it exists. They are not ordering allowances, and RICS does not present them as measured national averages.
Some long-used rates have turned out to be far too high. A 2023 study for the Mineral Products Association proposed a 5% wastage rate for concrete blocks in housebuilding, replacing the 20% baseline long used in WRAP's Net Waste tool. The same study looked at ready-mix. The same 2023 MPA study proposed a 1-2% wastage rate for ready-mixed concrete on commercial and public projects, below the 5% WRAP baseline and 2.5% WRAP good-practice rate. The sources disagree, and the table below sets the figures side by side rather than choosing one.
| Material | Default site waste rate (%) |
|---|---|
| Concrete in situ | 5 |
| Concrete precast | 1 |
| Steel reinforcement | 5 |
| Concrete blocks, lightweight AAC | 10 |
| Concrete blocks, dense/medium | 5 |
| Brickwork (clay) | 6 |
| Mortar and render | 4 |
| Screed | 8 |
| Floor finish (tile) | 6 |
| Floor finish (carpet) | 6 |
| Timber frames | 2 |
| Timber floors (boards) | 10 |
| Plasterboard | 4 |
| Insulation | 7 |
| Aggregate | 10 |
| Glass | 1 |
| Coatings (paint) | 6 |
| Asphalt | 6 |
| Roof cladding | 5 |
| Product | WRAP Net Waste baseline (%) | WRAP good practice (%) | MPA 2023 proposal (%) |
|---|---|---|---|
| Dense concrete blocks | 20 | 5 | 5 |
| Lightweight concrete blocks | 20 | 5 | 5 |
| In-situ / ready-mixed concrete | 5 | 2.5 | 1–2 |
How do waste rates compare with the extra people order?
Ordering allowances are usually higher than measured site waste rates, and they are meant to be. An allowance covers cuts, breakage and pattern layout, and also leaves spare stock for repairs. It also avoids running short on a pour or a matched batch. A waste rate measures what was actually thrown away. The table puts the ordering advice for each material, with who gives it, next to the waste figures above.
| Material | Ordering allowance (who states it) | Published site waste rate or US waste tonnage |
|---|---|---|
| Drywall / plasterboard | No manufacturer allowance in our fact base; sheets are counted from the take-off | RICS default 4%; US construction waste 3.9 million tons (2018) |
| Ready-mix concrete | 4–10% over plan volume (National Ready Mixed Concrete Association) | RICS in-situ default 5%; MPA proposal 1–2% |
| Concrete block | 5% for waste and breakage (Concrete Masonry & Hardscapes Association (formerly NCMA)) | MPA proposal 5% |
| Brick | At least 5% (Brick Industry Association) | US brick and clay tile construction waste is small; see the EPA table |
| Mortar | 15–25% (Brick Industry Association) | RICS mortar and render default in the table above |
| Asphalt shingles | 2–10% for trim waste (Asphalt Roofing Manufacturers Association (ARMA)) | US construction waste 1.2 million tons (2018) |
| Deck boards | 5% (Trex Company); 10% (TimberTech (The AZEK Company)) | US wood construction waste 3.4 million tons (2018, all wood) |
| Laminate and vinyl plank | 10% straight, 15% diagonal (Pergo (Mohawk)) | RICS timber floor boards default 10% |
| Hardwood flooring | 5–7% straight, 10–15% diagonal (Mullican Flooring) | RICS timber floor boards default 10% |
| Floor tile | 15% field tile, 20% patterns (Fireclay Tile) | RICS tile floor default 6% |
Does ordering extra material create more waste?
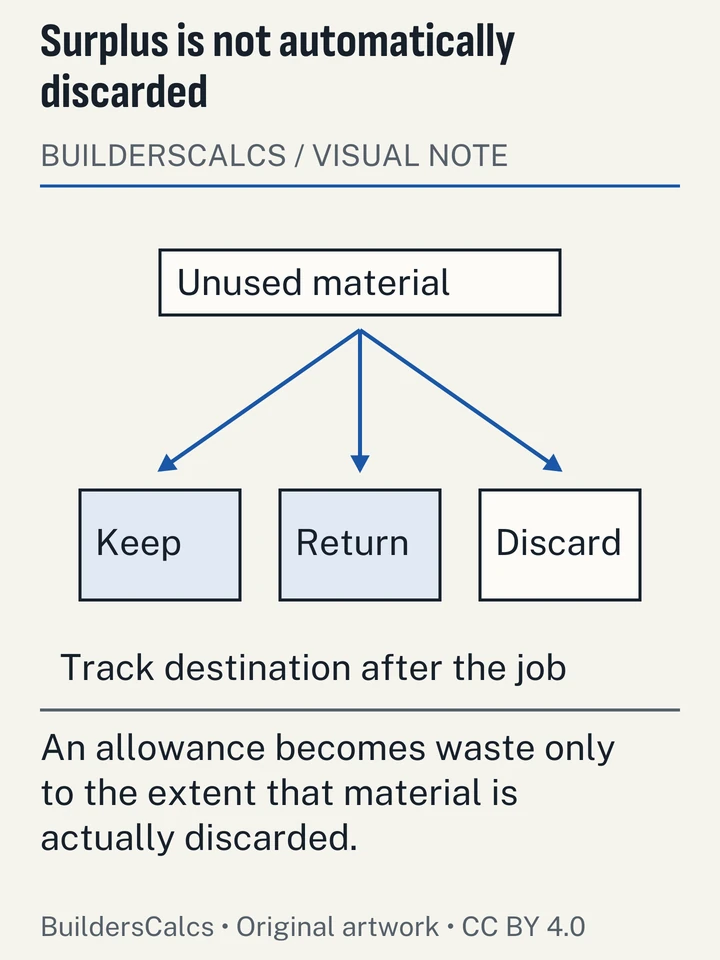
Not necessarily. A sensible allowance is not the same as waste. Unopened bags, whole sheets and spare boxes of the same batch can be returned, kept for repairs or used on the next job. What ends up in a skip or dumpster is mostly offcuts and damaged stock. That is why RICS's default rates are lower than most ordering allowances.
Waste comes from two kinds of mistake. Over-ordering by guesswork leaves material nobody can use. Under-ordering costs a second delivery, and with tile, flooring or paint it can leave a batch mismatch. The answer is to measure accurately, then add the allowance the manufacturer states for that layout, not a round number. The guide to choosing 5%, 10% or 15% waste goes material by material. The calculators apply those allowances to the quantity:
- drywall sheets, screws and mud
- laminate packs needed, rounded up to whole packs
- roof area from footprint and pitch, then bundles
- bricks per wall and the concrete block calculator for masonry
More sourced figures on materials and building are in our data library.
How we built this data
Sources. US figures are from EPA's Advancing Sustainable Materials Management: 2018 Facts and Figures report and tables, which EPA still lists as its latest C&D estimate. Generation by material comes from its Table 6 and landfill and next use from its Table 8. The per-square-foot figures for new homes come from EPA's 1998 characterization of building-related C&D debris. England figures are from Defra's UK statistics on waste (2024 provisional). EU figures are from Eurostat's waste generation dataset and its Statistics Explained summary. Site waste rates come from the RICS whole life carbon standard (2nd edition, 2023) and a 2023 study for the Mineral Products Association. Carpet and paint figures come from EPA, the Carpet America Recovery Effort and PaintCare Oregon.
What we did. We took the published figures and put them in one place, by material, with each source named. We did not measure any waste ourselves. Where sources disagree, we show both figures and say why.
Limits. The US data are from 2018, and the per-area new-home figure is from the 1990s. EPA's material list leaves out packaging, plastics, insulation and soil. In EPA's drywall row the management figures sum to slightly more than generation because of rounding. England's recovery rate excludes excavation and treats any non-landfill route as recovery. The RICS and MPA rates are defaults and proposals for UK practice, not measured US averages, and the MPA ready-mix figure is for commercial and public projects. We could not verify some sources: Dutch per-material studies, Massachusetts shingle data, the full WRAP Net Waste table and Eurostat's EU recovery rate. They are left out.
How to cite this page
The tables and charts on this page are licensed under Creative Commons Attribution 4.0 (CC BY 4.0). Credit BuildersCalcs with a link to this page, and name the original publisher (EPA, Defra, Eurostat, RICS or MPA) for the figure you use. The citation box at the end of the page copies a full reference.
Keep the year and the scope with any figure. A short form that works: 'US construction generated 3.9 million tons of drywall and plaster waste in 2018, EPA's latest estimate (via BuildersCalcs)'. Do not present the RICS default rates as measured national averages. They are defaults for carbon assessment.
Download the data and charts
The CSV holds all four source tables in long format: one row per table, row, column and value, with the source for each. The charts are 1200 by 750 pixel PNGs. Everything is under CC BY 4.0.
- CSVConstruction and demolition waste by material and site waste rates (CSV)
- PNGChart: US construction and demolition debris by material, 2018 (PNG)
- PNGChart: default site waste rates by material (PNG)
Questions about construction waste figures
Why are the US construction waste figures from 2018?
Because 2018 is the latest year EPA has published a national construction and demolition estimate for. EPA's web page still points to the 2018 Facts and Figures data. We will update this page when a newer edition appears.
Is drywall waste recyclable?
Clean gypsum offcuts can be recycled or, in some areas, used as a soil amendment. In practice most US drywall debris is not: EPA estimates 13.2 million tons went to landfill in 2018, against much less sent to a next use. Ask your local waste authority what it accepts.
Can I compare the US, England and EU totals?
Not directly. EPA's US total covers a fixed list of materials and leaves out soil. England's recovery rate covers non-hazardous C&D waste without excavation. The EU share includes excavated soil. Compare trends within each source, not totals across them.
Are RICS waste rates the same as ordering allowances?
No. RICS defaults estimate how much delivered material ends up as waste, for carbon calculations. An ordering allowance also covers spare stock, batch matching and layout, so it is usually higher. Use the manufacturer's stated allowance when you order.
Cite this page
You may reuse the figures and downloads on this page under CC BY 4.0. Please credit BuildersCalcs with a link to this page.
Sources (25)
- Asphalt Roofing Manufacturers Association (ARMA)
- Residential Asphalt Roofing Manual - Design and Application Methods, 2014 edition (Ch. 5 Estimating; Ch. 6 Safety), checked
- Brick Industry Association
- Technical Note 10: Dimensioning and Estimating Brick Masonry (Feb 2009), checked
- Carpet America Recovery Effort (CARE), filed with CalRecycle
- California Carpet Stewardship Program 2024 Annual Report, checked
- Concrete Masonry & Hardscapes Association (formerly NCMA)
- TEK 04-02A Estimating Concrete Masonry Materials, checked
- Department for Environment, Food & Rural Affairs (Defra)
- Plasterboard Sustainability Action Plan (PB13439, October 2010), checked
- UK statistics on waste (official statistics release, updated 23 September 2026), checked
- UK statistics on waste release figures and tables dataset 2026, checked
- Eurostat (European Commission)
- Generation of waste by waste category, hazardousness and NACE Rev. 2 activity (env_wasgen), checked
- Waste statistics - Statistics Explained (data extracted September 2024), checked
- Fireclay Tile
- Tile School: How to Avoid an Add-On Order, checked
- Mullican Flooring
- How to Calculate the Correct Footage When Purchasing Hardwood Flooring, checked
- National Ready Mixed Concrete Association
- CIP 31 - Ordering Ready Mixed Concrete, checked
- CIP 8 - Discrepancies in Yield (rev. 2016), checked
- PaintCare Oregon LLC (report to Oregon DEQ)
- Oregon Paint Stewardship Program 2024 Annual Report, checked
- Pergo (Mohawk)
- Pergo Installation Essentials Guide (1/4 in expansion version), checked
- Pergo Installation Essentials Guide (rev 012014, 3/8 in expansion version), checked
- Reusefully Ltd for the Mineral Products Association (MPA), Brick Development Association and BRMCA
- Interim findings: wastage rates for blocks and ready mixed concrete (V3, 20 March 2023), checked
- Royal Institution of Chartered Surveyors (RICS)
- Whole life carbon assessment for the built environment, 2nd edition (professional standard, September 2023), checked
- TimberTech (The AZEK Company)
- Decking Installation & Maintenance Guide - TimberTech Composite and Specialty Decking (REV 09/23), checked
- How to Calculate How Much Decking You Need, checked
- Trex Company
- How Many Deck Boards Do I Need?, checked
- US EPA (prepared by Franklin Associates), EPA530-R-98-010
- Characterization of Building-Related Construction and Demolition Debris in the United States, checked
- US Environmental Protection Agency (EPA)
- Advancing Sustainable Materials Management: Facts and Figures 2018 Tables and Figures, checked
- Construction and Demolition Debris: Material-Specific Data (1960-2018 summary table), checked
- US Environmental Protection Agency (EPA), Office of Resource Conservation and Recovery
- Advancing Sustainable Materials Management: 2018 Fact Sheet, checked
Every number on this page is taken from these documents. How we choose and check sources.