

Home insulation statistics: how many homes are under-insulated in the US and England (2024)
About 20% of US primary homes were reported as poorly insulated or not insulated in 2024, according to preliminary results from the US Energy Information Administration's Residential Energy Consumption Survey (RECS). In England, 42% of dwellings had 200 mm or more of loft insulation in 2024, according to the English Housing Survey. This page sets out both surveys by age of home, draughts and type of insulation, alongside the heating share of household energy, the savings estimates and the code levels new work must meet.
20% of US homes
were reported poorly insulated or not insulated in 2024 (EIA RECS, preliminary)
37% of pre-1950 homes
in the US were reported poorly insulated or not insulated, against a far smaller share of homes built since 2020
14% of US homes
were too drafty in winter most or all of the time in 2024
42% of English homes
had 200 mm or more of loft insulation in 2024 (English Housing Survey)
(UK Ministry of Housing, Communities and Local Government (MHCLG))
What are the main findings?
- One US home in five is under-insulated, by its occupants' account: About 20% of US primary homes (26.8 million of 132.5 million) were reported as poorly insulated (23.3 million) or not insulated (3.4 million) in EIA's 2024 Residential Energy Consumption Survey (preliminary).
- Age is the strongest pattern: About 37% of US homes built before 1950 (7.4 million of 20.25 million) were reported poorly insulated or not insulated in 2024, versus about 9% of homes built 2020 to 2024 (EIA RECS 2024, preliminary).
- Draughts are common: About 14% of US homes (18.2 million) were reported too drafty in winter most or all of the time, and another 54.8 million some of the time, in EIA's 2024 RECS (preliminary).
- Heating is the largest single use of home energy: 42% of US household site energy in 2020, and 61.5% of EU household energy in 2024.
- English loft insulation has moved slowly: In 2024, 42% of dwellings in England had 200mm or more of loft insulation, up from 39% in both 2014 and 2022 (English Housing Survey 2024-25, MHCLG).
- Wall insulation in England has risen faster: 54% of dwellings had cavity or solid wall insulation in 2024.
- ENERGY STAR's savings estimate: ENERGY STAR estimates homeowners save an average of 15% on heating and cooling costs (11% of total energy costs) by air sealing and adding insulation to attics, crawlspace floors and basement rim joists.
The US figures are what households report about their own homes, not inspections. The English figures come from a survey that includes a physical inspection of a sample of homes. The two are not directly comparable, and we do not compare them as if they were.
How many US homes are poorly insulated?
About one in five. About 20% of US primary homes (26.8 million of 132.5 million) were reported as poorly insulated (23.3 million) or not insulated (3.4 million) in EIA's 2024 Residential Energy Consumption Survey (preliminary). Most of the rest were described as adequately insulated, and a smaller group as well insulated.
These answers come from the household, not an energy auditor. People who have never looked in their attic may answer 'adequately' by default, and someone with a cold room may answer 'poorly' even if the attic is full. EIA labels the 2024 figures preliminary, so they may change slightly when the final release comes out.
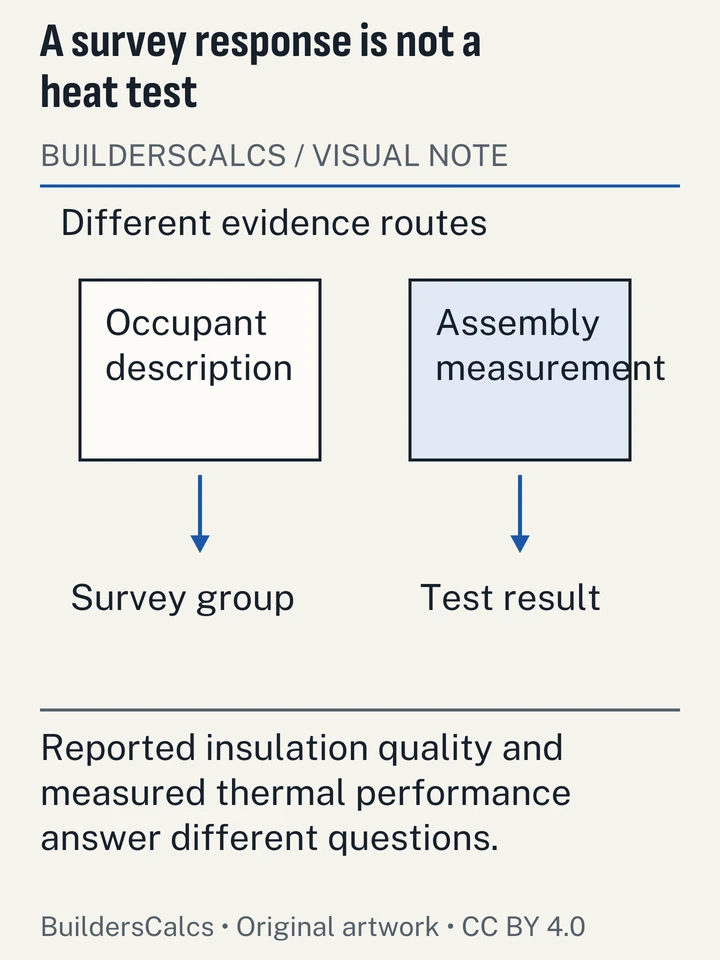
Illustration sources
- US Energy Information Administration (EIA) — 2024 RECS Table HC2.3: Structural and geographic characteristics of U.S. homes, by year of construction (preliminary)
- US Energy Information Administration (EIA) — 2024 RECS Table HC2.1: Structural and geographic characteristics of U.S. homes, by housing unit type (preliminary)
Are older homes less insulated?
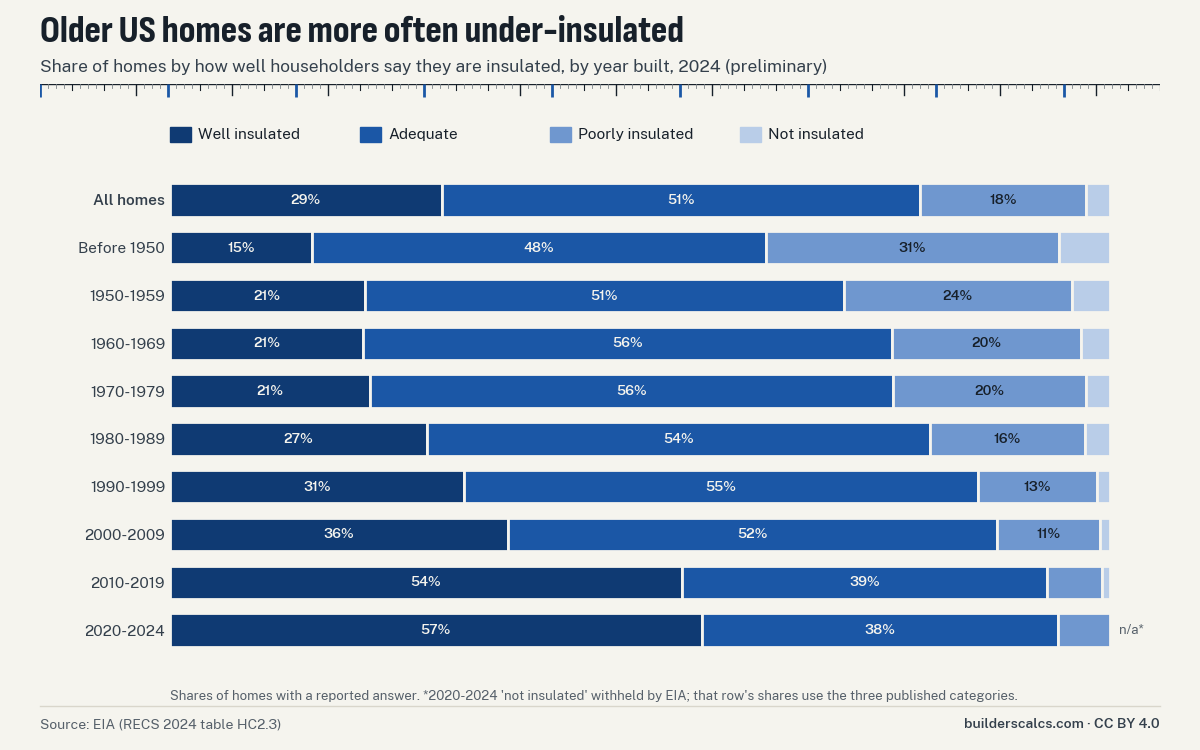
Yes, clearly. About 37% of US homes built before 1950 (7.4 million of 20.25 million) were reported poorly insulated or not insulated in 2024, versus about 9% of homes built 2020 to 2024 (EIA RECS 2024, preliminary). The share falls with almost every decade of construction, which fits the history of energy codes. Many older homes were built before any insulation requirement and have had only partial upgrades since.
The table gives the RECS counts in millions of homes. Homes built since 2010 are the best insulated by their occupants' account, but they are also the smallest group, so most poorly insulated homes in the US are older homes.
| Year built | Well insulated (m) | Adequately insulated (m) | Poorly insulated (m) | Not insulated (m) |
|---|---|---|---|---|
| All homes | 38.32 | 67.44 | 23.33 | 3.44 |
| Before 1950 | 3.05 | 9.79 | 6.3 | 1.1 |
| 1950–1959 | 2.52 | 6.2 | 2.96 | 0.49 |
| 1960–1969 | 2.62 | 7.16 | 2.56 | 0.39 |
| 1970–1979 | 3.86 | 10.07 | 3.71 | 0.46 |
| 1980–1989 | 4.54 | 8.89 | 2.73 | 0.45 |
| 1990–1999 | 4.97 | 8.7 | 2.01 | 0.22 |
| 2000–2009 | 6.57 | 9.52 | 2 | 0.19 |
| 2010–2019 | 6.8 | 4.84 | 0.74 | 0.1 |
| 2020–2024 | 3.4 | 2.28 | 0.33 | None |
How many US homes are drafty?
About 14% of US homes (18.2 million) were reported too drafty in winter most or all of the time, and another 54.8 million some of the time, in EIA's 2024 RECS (preliminary). Put together, more than half of US homes were drafty at least some of the time.
Draughts and insulation are separate problems. Insulation slows heat moving through walls and ceilings. Air leaks let warm air out through gaps around attic hatches, top plates, pipes and wiring. That is why ENERGY STAR and most energy auditors put air sealing first and insulation second. Adding insulation over open gaps leaves much of the problem in place.
How much home energy is used for heating?
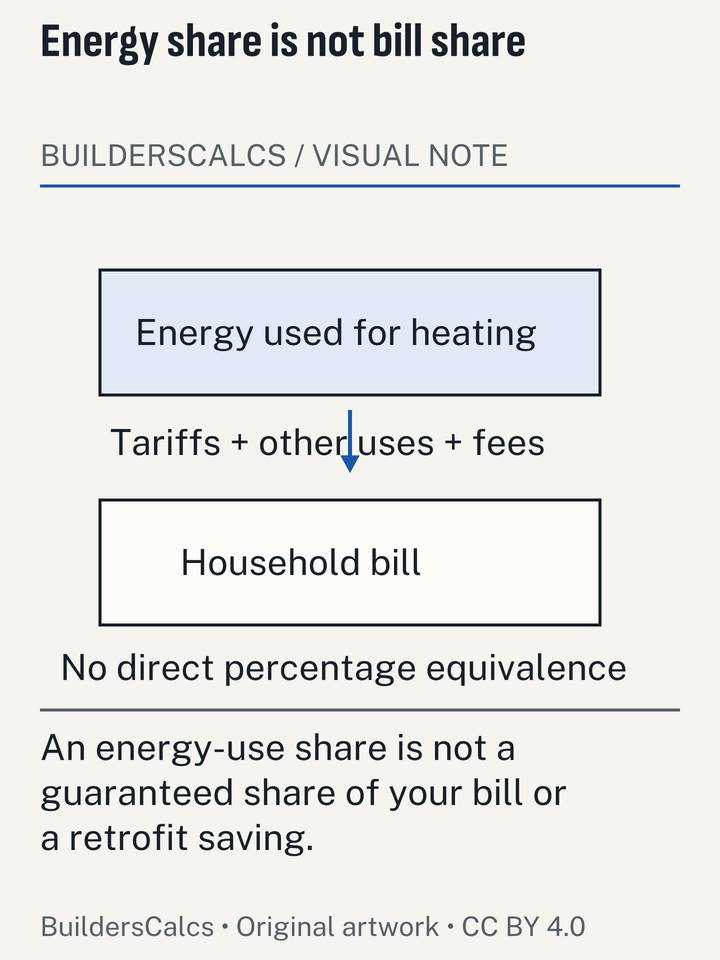
Heating is the largest single end use in US and EU homes. Space heating used 4,026 of 9,481 trillion Btu of US household site energy in 2020 (about 42%), and air conditioning 866 trillion Btu (about 9%), per EIA's 2020 RECS, the latest end-use edition (2024 RECS consumption data due 2027). That 2020 survey is the latest US edition with end-use figures.
The EU share is higher, mainly because of climate and fewer homes with air conditioning. Space heating took 61.5% of EU household final energy consumption in 2024 (space plus water heating 77.1%), and households used 26.0% of all EU final energy (Eurostat). The two figures use different methods and years, so treat the gap between them as a broad difference, not an exact one.
| Space heating | Water heating | Air conditioning | Refrigerators | Other | Total |
|---|---|---|---|---|---|
| 4,026 | 1,737 | 866 | 352 | 2,501 | 9,481 |
| Space heating | Water heating | Lighting and appliances | Cooking | Space cooling | Other |
|---|---|---|---|---|---|
| 61.5 | 15.6 | 14.8 | 6.4 | 0.8 | 0.9 |
How much can insulation and air sealing save?
ENERGY STAR's estimate is the most widely used. ENERGY STAR estimates homeowners save an average of 15% on heating and cooling costs (11% of total energy costs) by air sealing and adding insulation to attics, crawlspace floors and basement rim joists. The savings are modelled, not measured in individual homes, and they are larger in cold climates, as the table shows.
At national scale, the latest peer-reviewed estimate of its kind is from 2016. Bringing insulation in all continental US single-family homes up to 2012 IECC levels would save about 37 TWh of electricity a year (3.4% of residential use) and 9% of residential natural gas, per a 2016 peer-reviewed Boston University study using 2013 data, still the latest national estimate of its kind.
A common belief needs correcting here. A figure claiming that almost every US home is under-insulated is widely repeated, usually credited to the same Boston University research. We could not find that claim in the peer-reviewed paper itself, only in press coverage, so we do not use it. The best direct measure is the RECS figure above, and it is much lower.
| Climate zones | Total house savings (%) | Heating and cooling savings (%) |
|---|---|---|
| CZ 4-8 (northern) | 12–16 | 16–20 |
| CZ 1-3 (southern) | 5–8 | 7–14 |
How many homes in England have loft and wall insulation?
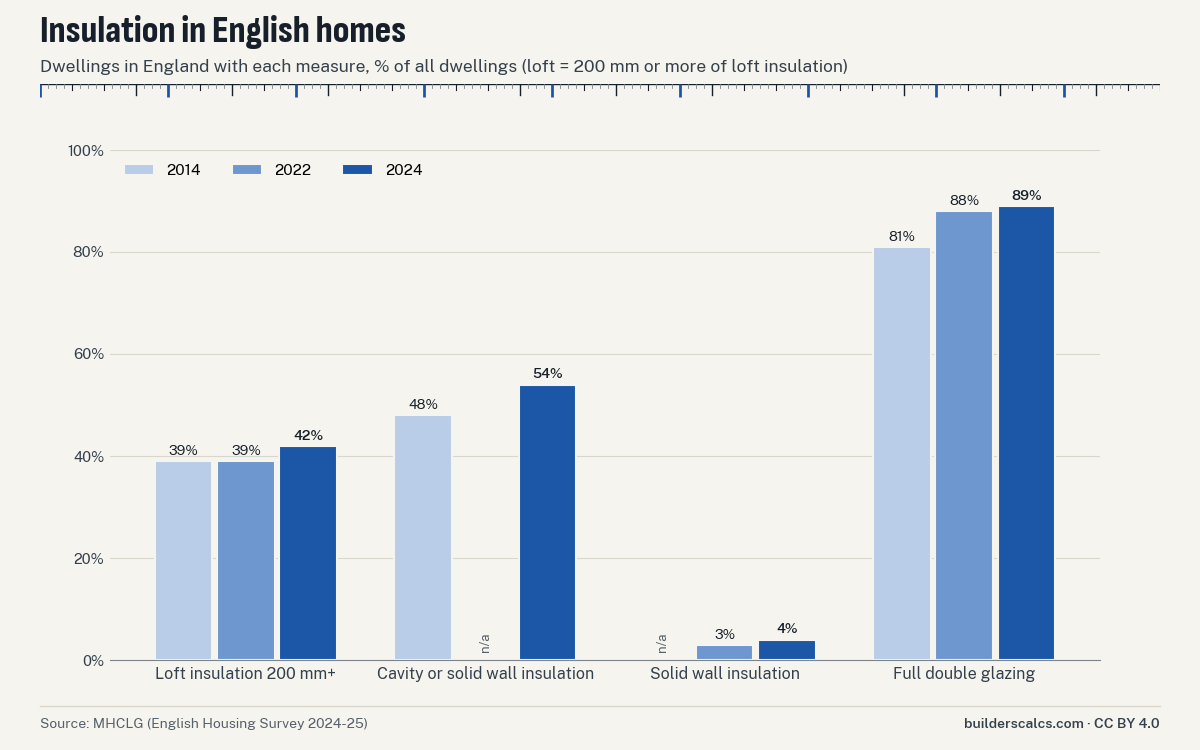
In 2024, 42% of dwellings in England had 200mm or more of loft insulation, up from 39% in both 2014 and 2022 (English Housing Survey 2024-25, MHCLG). The English Housing Survey's own reports give two slightly different figures for 2014, and we use the one in the body text.
Wall insulation has risen faster. 54% of dwellings in England had cavity or solid wall insulation in 2024, up from 48% in 2014; among cavity-wall homes, 73% of owner-occupied but only 60% of private rented had it insulated (English Housing Survey 2024-25). The gap between owner-occupied and private rented homes is one of the clearest findings in the survey.
A sizeable group of homes has little or no loft insulation. Over 2.7 million households in England lived in homes with less than 100mm of loft insulation in 2024-25; 1.2 million of them (43%) also had uninsulated solid walls (EHS home insulation fact sheet, May 2026).
| Measure | 2014 | 2022 | 2024 |
|---|---|---|---|
| Loft insulation 200mm+ | 39 | 39 | 42 |
| Cavity or solid wall insulation | 48 | None | 54 |
| Solid wall insulation | None | 3 | 4 |
| Full double glazing | 81 | 88 | 89 |
What insulation is in English lofts?
Almost all of it is mineral wool or glass fibre. 94% of English dwellings with loft insulation (just under 18 million) used mineral wool or glass fibre in 2024, against 4% rigid foam board and 1% spray foam (EHS home insulation fact sheet). Rolls of glass or mineral wool laid between and over the joists are the standard loft upgrade in Britain. Rigid board and spray foam are mostly used where there is no usable loft floor, such as rooms in the roof.
How the main types compare on thermal resistance per inch, cost of fitting and fire behaviour is set out in our R-value per inch by insulation type comparison.
How much insulation do the codes require?
In the US, the 2021 International Energy Conservation Code sets minimum R-values by climate zone. For ceilings: IECC 2021 requires R-30 (RSI 5.3) ceiling insulation in climate zones 0-1. IECC 2021 requires R-49 (RSI 8.6) ceiling insulation in climate zones 2 and 3. IECC 2021 requires R-60 (RSI 10.6) ceiling insulation in climate zones 4-8. States adopt code editions on their own timetable, so check which edition your building department enforces.
In England, Approved Document L sets maximum U-values instead. In England, new-dwelling roofs must not exceed U = 0.16 W/m2K (limiting value). New-dwelling walls in England must not exceed U = 0.26 W/m2K. These are backstops. Approved Document L's limiting U-values are backstops; some elements usually need to be significantly better to meet overall targets.
The two systems do not convert one to one. A U-value is the reciprocal of the total RSI of all layers including surface resistances, so it cannot be compared directly with an insulation-only R-value. The climate-zone insulation guide explains how to read your zone and the target for each part of the house.
| Climate zone | Ceiling R | Wood-frame wall R | Floor R |
|---|---|---|---|
| 0 | 30 | 13 or 0&10ci | 13 |
| 1 | 30 | 13 or 0&10ci | 13 |
| 2 | 49 | 13 or 0&10ci | 13 |
| 3 | 49 | 20 or 13&5ci or 0&15ci | 19 |
| 4 except Marine | 60 | 30 or 20&5ci or 13&10ci or 0&20ci | 19 |
| 5 and Marine 4 | 60 | 30 or 20&5ci or 13&10ci or 0&20ci | 30 |
| 6 | 60 | 30 or 20&5ci or 13&10ci or 0&20ci | 30 |
| 7 and 8 | 60 | 30 or 20&5ci or 13&10ci or 0&20ci | 38 |
| Element | New dwelling | New element, existing dwelling | Existing element, threshold | Existing element, improved |
|---|---|---|---|---|
| roof | 0.16 | 0.15 | 0.35 | 0.16 |
| wall | 0.26 | 0.18 | 0.7 | 0.55 cavity / 0.30 internal or external |
| floor | 0.18 | 0.18 | 0.7 | 0.25 |
| window | 1.6 | 1.4 | None | None |
| door | 1.6 | 1.4 | None | None |
How do I plan an insulation upgrade from these figures?
Start with what is in your attic now, then work towards the level for your climate zone. These pages do the planning from published code and maker figures:
- The batts or rolls of insulation tool counts packages of batts or bags of blown-in fill from the area and the R-value you want.
- The climate-zone insulation guide gives the target for attics, walls and floors.
- The R-value per inch by insulation type comparison helps where depth is limited.
- Other insulation tools sit in the thermal insulation category.
Seal air leaks before adding insulation, keep insulation clear of recessed lights not rated for contact, and keep eaves ventilation open. Price changes for insulation materials are tracked on the lumber, drywall and insulation price index page.
How we built this data
Sources. US insulation and draught figures come from EIA's 2024 Residential Energy Consumption Survey housing characteristics tables, which EIA labels preliminary. US energy end use comes from the 2020 RECS consumption tables, the latest edition with end-use estimates. England figures come from the English Housing Survey 2024-25 headline report and its home insulation fact sheet, published by MHCLG. EU energy shares come from Eurostat. Savings estimates come from ENERGY STAR's air sealing and insulation method and a 2016 paper in Environmental Research Letters. Code values come from IECC 2021 and Approved Document L 2021. All sources were read in October 2026.
Method. We recorded each figure as published, kept EIA's counts in millions of homes, and drew the two charts from the same tables shown here. Where a survey gave two figures for the same thing, we say so and state which one we used.
Limits. RECS insulation levels are self-reported by households, so they measure how people judge their homes, not measured R-values. The English Housing Survey uses physical inspection of a sample of homes, so the two surveys measure different things and should not be ranked against each other. Savings figures are modelled estimates. The national savings study used 2013 data.
How to cite this page
You can reuse the figures, charts and tables on this page under the Creative Commons Attribution 4.0 licence (CC BY 4.0). Credit BuildersCalcs and link to this page. The citation line in the box at the end of the page copies with one click.
Please keep the year, the country and the word 'reported' with US figures. A short form that works in most articles: 'about 20% of US homes were reported poorly insulated or not insulated in 2024 (EIA RECS data via BuildersCalcs)'. Please name EIA or the English Housing Survey as the underlying source as well. Our part is the selection, the charts and putting US, UK and EU figures side by side.
Download the charts
Both charts as PNG images, free to reuse under CC BY 4.0 with a credit link to this page.
- CSVBuilding performance and insulation tables (CSV)
- PNGUS homes by reported insulation level and year built, 2024 (PNG)
- PNGDwellings in England with insulation measures, 2014–2024 (PNG)
Questions about home insulation figures
Where does the one-in-five figure for US homes come from?
From EIA's 2024 Residential Energy Consumption Survey. Households were asked how well insulated their home is. About 20% of US primary homes (26.8 million of 132.5 million) were reported as poorly insulated (23.3 million) or not insulated (3.4 million) in EIA's 2024 Residential Energy Consumption Survey (preliminary).
Is the UK or the US better insulated?
The surveys cannot answer that. The US survey asks occupants for their opinion, while the English survey records specific measures such as loft depth and wall insulation. The building stock, climate and codes also differ. Compare each country with itself over time rather than with the other.
How much will insulating my attic save?
It depends on your climate, your starting level and how leaky the house is. ENERGY STAR's national average for air sealing plus insulation is 15% of heating and cooling costs, with larger savings in colder zones. An energy audit gives a figure for your own home.
Why is the US heating figure from 2020 and not 2024?
EIA publishes RECS in stages. The 2024 housing characteristics, including insulation and draughts, are out, but the 2024 energy end-use figures are not yet released, so 2020 is the latest edition with heating shares.
Cite this page
You may reuse the figures and downloads on this page under CC BY 4.0. Please credit BuildersCalcs with a link to this page.
Sources (11)
- Environmental Research Letters (IOP); Levy et al., Boston University
- Carbon reductions and health co-benefits from US residential energy efficiency measures, checked
- Eurostat
- Energy consumption in households (Statistics Explained; data nrg_d_hhq, extracted June 2026), checked
- International Code Council
- 2021 IECC Residential, Chapter 4 (Tables R402.1.2, R402.1.3; Sections R402.1.4, R402.2.1), checked
- U.S. EPA ENERGY STAR
- Recommended Home Insulation R-Values, checked
- UK Government (DLUHC)
- Approved Document L, Volume 1: Dwellings, 2021 edition incorporating 2023 amendments (Tables 4.1-4.3), checked
- UK Ministry of Housing, Communities and Local Government (MHCLG)
- English Housing Survey 2024 to 2025: Headline Report on Housing Quality and Energy Efficiency, checked
- English Housing Survey 2024 to 2025: home insulation - fact sheet, checked
- US EPA ENERGY STAR
- Methodology for Estimated Energy Savings from Cost-Effective Air Sealing and Insulating, checked
- US Energy Information Administration (EIA)
- 2020 RECS Table CE3.1: Annual household site end-use consumption in the United States, totals and averages, checked
- 2024 RECS Table HC2.1: Structural and geographic characteristics of U.S. homes, by housing unit type (preliminary), checked
- 2024 RECS Table HC2.3: Structural and geographic characteristics of U.S. homes, by year of construction (preliminary), checked
Every number on this page is taken from these documents. How we choose and check sources.