

DIY and home construction injury statistics: ladders, stairs, decks, fences and roofs (2015–2025)
An estimated 1,310,287 people were treated in US hospital emergency departments in 2025 for injuries involving stairs or steps, and 189,731 for injuries involving ladders. These figures come from our own analysis of the US Consumer Product Safety Commission's NEISS sample. The data set covers 2015 to 2025 and gives a 95% confidence interval for every estimate. Below are the figures for stairs, ladders, porches and decks, fences, roofs and nail guns, how we produced them, and how to cite them.
1,310,287ED-treated injuries
involving stairs or steps in the US in 2025, the largest group in this data set
189,731ED-treated injuries
involving ladders in 2025, with fracture the diagnosis in 35.2% of them
151,403ED-treated injuries
involving porches, balconies and open-side floors (the NEISS code that covers decks) in 2025
26.2% admitted
of people treated after a roof fall in 2025 were admitted to hospital, against 12.8% for stair injuries
What are the main findings?
- Stairs and steps are by far the largest group: 1,310,287 ED-treated injuries in 2025, more than every other group on this page combined.
- Ladder injuries are the more serious ones: 189,731 in 2025, with fracture the diagnosis in 35.2% and 19.5% admitted to hospital.
- Porches and decks, and fences, are steady from year to year: 151,403 and 115,803 in 2025, almost unchanged from 2024.
- Roof falls are few but the most severe: at least 7,317 in 2025, with 26.2% admitted, about twice the stair rate.
- Older adults dominate stair and step-stool injuries: people aged 65 and over made up 32.3% of stair injuries and 48.5% of step-stool injuries.
- The 2023 to 2024 jump is mostly a change of method: CPSC redesigned its hospital sample for 2024, so the series breaks there.
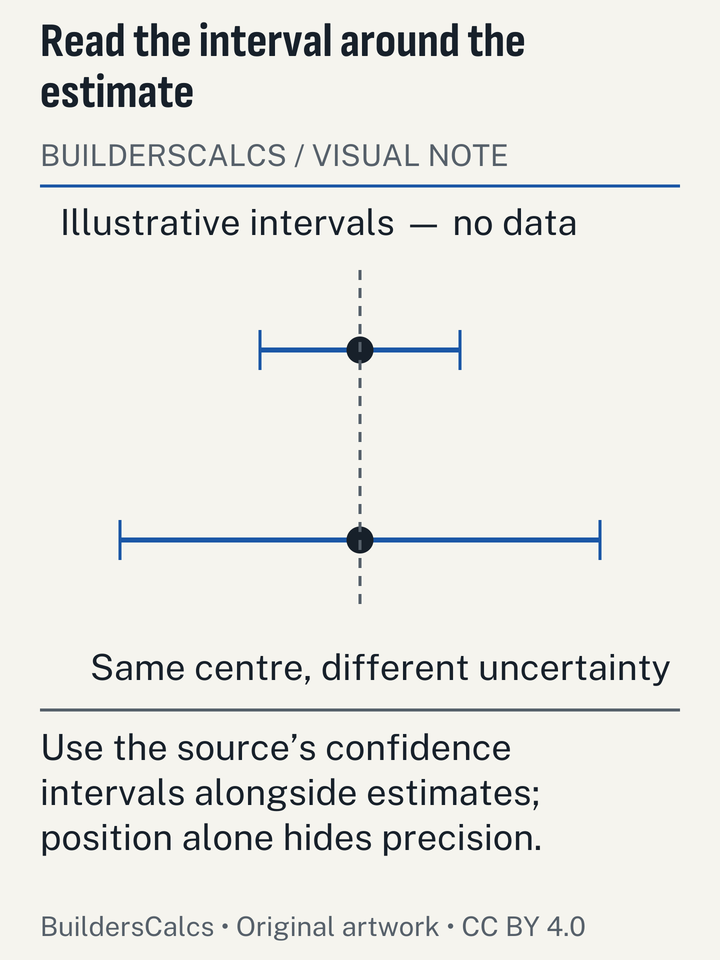
Every estimate here is a weighted national estimate from a hospital sample, so each has a margin of error. The 95% intervals are in the sections below, the precision table and the download. Please quote the interval with the figure where you can.
Which home products cause the most emergency-department injuries?
Stairs and steps cause more emergency-department visits than every other product group here put together. Ladders, porches and decks, and fences follow, each in the low to mid hundreds of thousands. The chart shows 2025 national estimates for each product group we analysed. Several groups are small, so read them with their intervals in the 95% CI table further down.
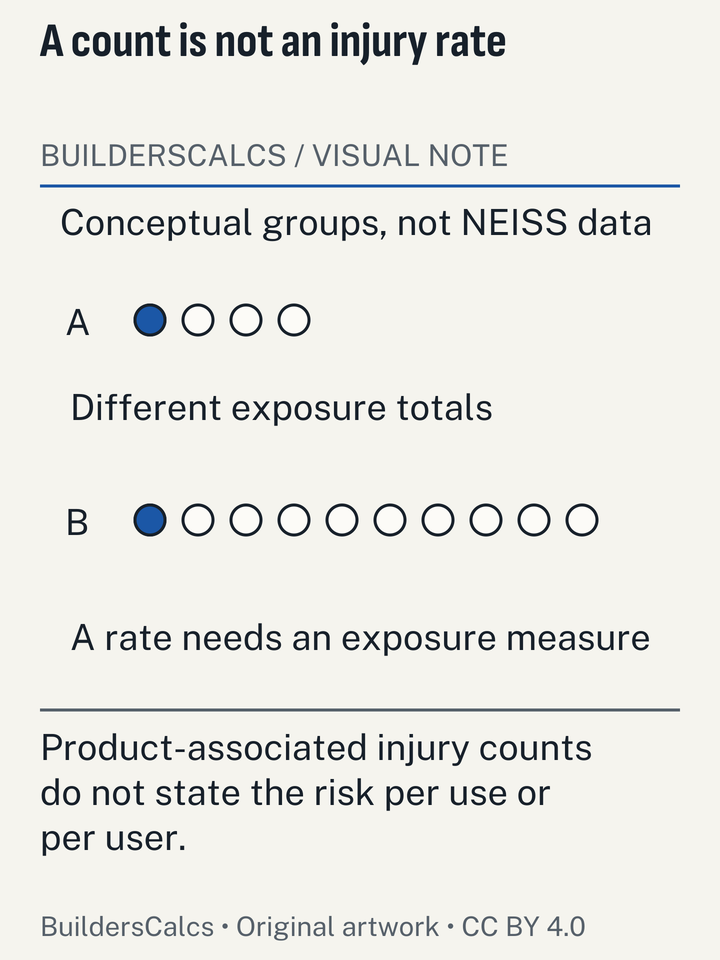
Illustration sources
How many people are injured on stairs each year?
An estimated 1,310,287 people (95% CI 1,082,129–1,538,444) were treated in US hospital emergency departments in 2025 for injuries involving stairs or steps (product code 1842), per our analysis of CPSC NEISS data. That is more than a million people a year, and the 2024 figure was similar. An estimated 1,252,579 people (95% CI 1,047,887–1,457,270) were treated in US hospital emergency departments in 2024 for injuries involving stairs or steps (product code 1842), per our analysis of CPSC NEISS data. 2024 is the first year of CPSC's redesigned hospital sample, so the rise from 2023 is not a clean trend.
Stair injuries fall most heavily on older people. People aged 65 and over made up 32.3% of stair and step injuries treated in US emergency departments in 2025 (423,006 of the national estimate, 95% CI 346,762–499,249), per our analysis of CPSC NEISS 2025 data. Most people are treated and sent home, but a large minority are not. 12.8% of people treated in US emergency departments for stair or step injuries in 2025 were admitted to hospital (167,351 of the national estimate, 95% CI 122,145–212,557), per our analysis of CPSC NEISS 2025 data. The head is the most common injured body part, ahead of the ankle and the lower trunk. Fractures are the most common named diagnosis, though the catch-all 'other' category is larger.
Stairs are also where a building's geometry shows up in injury data. Uneven risers are a known trip hazard, which is why the codes cap how much risers in one flight may vary. The stair calculator divides the total rise into equal risers inside the limits below. NEISS records the product involved, not the cause, so these figures cannot tell you how many stair injuries came from badly built stairs.
| Body part | Estimate | 95% CI low | 95% CI high | Share (%) |
|---|---|---|---|---|
| Head | 251,149 | 209,493 | 292,805 | 19.2 |
| Ankle | 179,440 | 147,382 | 211,498 | 13.7 |
| Lower trunk | 150,074 | 123,211 | 176,937 | 11.5 |
| Upper trunk | 115,165 | 87,584 | 142,747 | 8.8 |
| Knee | 106,907 | 86,602 | 127,212 | 8.2 |
| Face | 82,185 | 62,852 | 101,518 | 6.3 |
| Foot | 63,799 | 50,980 | 76,618 | 4.9 |
| Shoulder | 58,821 | 47,911 | 69,731 | 4.5 |
How many people fall off ladders each year?
An estimated 189,731 people (95% CI 152,918–226,543) were treated in US hospital emergency departments in 2025 for injuries involving ladders (stepladders, straight, extension and other ladders; codes 618, 619, 688, 4032, 4033, 4077, 4078), per our analysis of CPSC NEISS data. The 2024 figure was almost the same. An estimated 191,169 people (95% CI 152,854–229,485) were treated in US hospital emergency departments in 2024 for injuries involving ladders (all ladder product codes), per our analysis of CPSC NEISS data. 2024 is the first year of CPSC's redesigned hospital sample.
Ladder injuries are more severe than stair injuries. Fractures were the diagnosis in 35.2% of ladder injuries treated in US emergency departments in 2025 (66,812 of the national estimate, 95% CI 51,841–81,783), per our analysis of CPSC NEISS 2025 data. 19.5% of people treated in US emergency departments for ladder injuries in 2025 were admitted to hospital, against 12.8% for stair injuries (36,970 of the national estimate, 95% CI 22,465–51,475), per our analysis of CPSC NEISS 2025 data. The head and the upper and lower trunk are the most often injured body parts, which fits falls from height rather than slips at ground level.
Many people picture ladder injuries as a problem for young, inexperienced DIYers. Our 2025 age breakdown says otherwise: most patients were middle-aged or older, and under-25s were a small minority. The age rows are in the CSV download. Step stools follow the same pattern even more strongly. People aged 65 and over made up 48.5% of step-stool injuries treated in US emergency departments in 2025 (10,845 of the national estimate, 95% CI 8,010–13,679), per our analysis of CPSC NEISS 2025 data.
| Diagnosis | Estimate | 95% CI low | 95% CI high | Share (%) |
|---|---|---|---|---|
| Fracture | 66,812 | 51,841 | 81,783 | 35.2 |
| Other | 37,156 | 28,706 | 45,606 | 19.6 |
| Internal injury | 22,798 | 16,838 | 28,759 | 12 |
| Contusion/abrasion | 18,665 | 14,688 | 22,641 | 9.8 |
| Strain/sprain | 15,027 | 11,771 | 18,282 | 7.9 |
| Laceration | 14,854 | 11,791 | 17,917 | 7.8 |
| Concussion | 3,611 | 2,490 | 4,733 | 1.9 |
| Dislocation | 3,478 | 2,423 | 4,534 | 1.8 |
How high do people fall from when ladders cause injuries?
Mostly from low heights. The best national evidence is older, and it covers workers rather than homeowners. Falls of 6 to 10 feet accounted for 50% of ED-treated work ladder-fall injuries in 2011, and nearly 90% were from under 16 feet (NIOSH, MMWR 2014; latest such study). Work-related ladder falls killed 113 US workers in 2011 and caused an estimated 34,000 emergency department visits, per NIOSH's MMWR analysis, still the latest national cross-source study of its kind.
Deaths from work falls show the same pattern. Of the 844 US workers killed by falls, slips and trips in 2024, 10.8% fell from a height over 30 feet (BLS CFOI). The large majority of fatal falls were from lower heights. A short climb to a gutter or a low roof is not a safe one.
How many deck and porch injuries happen each year?
An estimated 151,403 people (95% CI 121,876–180,930) were treated in US hospital emergency departments in 2025 for injuries involving porches, balconies, open-side floors or floor openings (code 1817), per our analysis of CPSC NEISS data. NEISS has no separate product code for decks, so the figure covers porches, balconies, open-side floors and floor openings together. The 2024 figure was almost exactly the same, and it lets us check our method against CPSC's own. An estimated 151,222 people (95% CI 122,428–180,016) were treated in US hospital emergency departments in 2024 for injuries involving porches, balconies, open-side floors or floor openings (code 1817, the NEISS code covering decks), per our analysis of CPSC NEISS data. CPSC publishes the same figure, 151,222, in its 2024 NEISS Data Highlights.
These are mostly injuries at home. 70.7% of porch, balcony and open-side floor injuries treated in US emergency departments in 2025 happened at home (107,089 of the national estimate, 95% CI 81,804–132,373), per our analysis of CPSC NEISS 2025 data. Fractures lead the diagnoses, and the head is the most often injured body part. The narrative field does not reliably say whether a structure failed or someone tripped, so these figures are not a count of deck collapses.
Nail guns, the usual tool for framing a deck, are a much smaller group. An estimated 10,860 people (95% CI 7,842–13,878) were treated in US hospital emergency departments in 2025 for injuries involving nail guns or stud drivers (code 882), per our analysis of CPSC NEISS data. If you are planning the boards, the decking boards and screws tool gives board, joist-spacing and fastener counts from the manufacturers' figures.
| Diagnosis | Estimate | 95% CI low | 95% CI high | Share (%) |
|---|---|---|---|---|
| Fracture | 35,869 | 27,887 | 43,851 | 23.7 |
| Other | 30,612 | 23,632 | 37,593 | 20.2 |
| Contusion/abrasion | 20,699 | 16,411 | 24,986 | 13.7 |
| Internal injury | 19,832 | 14,377 | 25,287 | 13.1 |
| Strain/sprain | 15,136 | 9,943 | 20,330 | 10 |
| Laceration | 14,925 | 11,494 | 18,356 | 9.9 |
| Hematoma | 2,335 | 1,387 | 3,283 | 1.5 |
| Dislocation | 1,999 | 1,100 | 2,899 | 1.3 |
How many people are hurt by fences each year?
An estimated 115,803 people (95% CI 98,955–132,650) were treated in US hospital emergency departments in 2025 for injuries involving fences or fence posts (code 1871), per our analysis of CPSC NEISS data. That is a little below 2024. An estimated 118,863 people (95% CI 101,226–136,500) were treated in US hospital emergency departments in 2024 for injuries involving fences or fence posts (code 1871), per our analysis of CPSC NEISS data. CPSC publishes the same figure, 118,863, in its 2024 NEISS Data Highlights.
Fence injuries are more often cuts than falls. Lacerations were the diagnosis in 29.9% of fence and fence-post injuries treated in US emergency departments in 2025 (34,603 of the national estimate, 95% CI 29,130–40,077), per our analysis of CPSC NEISS 2025 data. That fits injuries from wire, pickets and sharp edges, including people climbing over fences, not only people building them. NEISS does not separate building a fence from other contact with one.
Post holes are the part of fence building where injuries are hardest to count. The NEISS codes for post-hole augers and drivers returned no cases in any year from 2015 to 2025, so we cannot give an estimate. If you are planning a fence, the materials for a wood fence tool counts posts, rails and concrete. Have buried utilities marked before you dig, and wear eye protection when cutting.
How many people are injured falling from roofs?
An estimated 7,317 people (95% CI 5,224–9,410) were treated in US hospital emergency departments in 2025 for injuries involving falls from or onto a roof, identified from the case narrative because NEISS has no roof product code, per our analysis of CPSC NEISS data. Narratives are short, so this is a lower bound. We found these cases by searching the short case descriptions for falls from or onto a roof.
Roof falls are the most severe injuries in this data set. 26.2% of people treated in US emergency departments in 2025 after a narrative-identified roof fall were admitted to hospital, about twice the 12.8% for stair injuries (1,920 of the national estimate, 95% CI 1,152–2,688), per our analysis of CPSC NEISS 2025 data. Among workers, roofing is the trade where falls dominate deaths. Falls, slips and trips accounted for 96 of the 120 fatal work injuries among US roofing contractors in 2024, or 80% (BLS CFOI).
The safest measurement for a roofing estimate is one taken without climbing. Our roof measuring without a ladder guide works from the house footprint and the pitch. The roofing calculator then turns that area into squares, bundles and underlayment.
Are DIY injuries going up?
Not clearly. Most groups were flat or falling from 2015 to 2019, dropped in 2020, recovered slowly, then jumped in 2024. That 2024 jump is mostly a change in how the sample is drawn. CPSC's 2024 NEISS estimates come from a redesigned sample of 100 hospitals, of which 77 reported, while 2023 estimates used the older 96-hospital sample, so 2023-to-2024 changes are not clean trends (the all-product estimate jumps from 12.74 million to 15.07 million). CPSC did not recalculate the 2015 to 2023 files on the new sample. Comparisons inside 2015 to 2023, or between 2024 and 2025, are fair. Comparisons that cross from 2023 to 2024 mix real change with sample change.
The 2020 dip reflects fewer emergency visits during the pandemic, not safer stairs or ladders. Between 2024 and 2025, on the same sample, the stair and ladder estimates moved by less than their confidence intervals, so the honest reading is 'no clear change'.
| Product group | 2015 | 2016 | 2017 | 2018 | 2019 | 2020 | 2021 | 2022 | 2023 | 2024 | 2025 |
|---|---|---|---|---|---|---|---|---|---|---|---|
| Stairs or steps | 1,195,154 | 1,240,936 | 1,277,904 | 1,231,116 | 1,169,107 | 941,790 | 1,005,147 | 1,033,033 | 1,049,958 | 1,252,579 | 1,310,287 |
| Ladders (all) | 186,327 | 189,153 | 193,798 | 172,254 | 168,253 | 164,900 | 150,228 | 155,093 | 159,454 | 191,169 | 189,731 |
| Step stools | 20,975 | 16,527 | 20,973 | 19,071 | 17,567 | 17,205 | 16,421 | 19,399 | 18,775 | 23,405 | 22,377 |
| Porches, balconies, open-side floors | 149,825 | 162,562 | 158,483 | 146,977 | 150,766 | 127,563 | 122,006 | 125,132 | 112,997 | 151,222 | 151,403 |
| Handrails, railings, banisters | 54,220 | 56,044 | 58,659 | 54,474 | 54,896 | 44,677 | 48,001 | 45,092 | 47,241 | 56,964 | 62,880 |
| Fences or fence posts | 116,999 | 116,822 | 113,650 | 106,921 | 104,265 | 93,530 | 93,846 | 103,354 | 99,859 | 118,863 | 115,803 |
| House repair/construction materials NEC | 15,227 | 22,789 | 27,079 | 26,165 | 20,369 | 23,470 | 17,725 | 23,546 | 20,962 | 31,512 | 31,362 |
| Nail guns | 11,041 | 9,095 | 9,977 | 9,248 | 9,570 | 8,350 | 7,344 | 8,473 | 9,646 | 9,057 | 10,860 |
| Scaffolding | 3,586 | 4,516 | 4,973 | 4,659 | 4,122 | 4,423 | 4,608 | 5,555 | 5,899 | 5,411 | 6,207 |
| Roof falls (narrative-identified) | 6,341 | 4,895 | 6,142 | 5,928 | 6,437 | 5,183 | 5,855 | 4,858 | 6,322 | 5,591 | 7,317 |
How precise are these estimates?
Every estimate here passes CPSC's reliability rule. The interval shows how far the true national figure could reasonably sit from the estimate. Small groups such as scaffolding, nail guns and roof falls have the widest intervals relative to their size. The coefficient of variation (CV) is the standard error as a share of the estimate.
| Product group | Year | Sample cases | Estimate | 95% CI low | 95% CI high | CV (%) | Meets CPSC rule |
|---|---|---|---|---|---|---|---|
| Stairs or steps | 2024 | 29,204 | 1,252,579 | 1,047,887 | 1,457,270 | 8.3 | yes |
| Stairs or steps | 2025 | 31,688 | 1,310,287 | 1,082,129 | 1,538,444 | 8.9 | yes |
| Ladders (all) | 2024 | 3,744 | 191,169 | 152,854 | 229,485 | 10.2 | yes |
| Ladders (all) | 2025 | 3,907 | 189,731 | 152,918 | 226,543 | 9.9 | yes |
| Step stools | 2024 | 481 | 23,405 | 18,711 | 28,100 | 10.2 | yes |
| Step stools | 2025 | 521 | 22,377 | 17,653 | 27,102 | 10.8 | yes |
| Porches, balconies, open-side floors | 2024 | 3,127 | 151,222 | 122,428 | 180,016 | 9.7 | yes |
| Porches, balconies, open-side floors | 2025 | 3,386 | 151,403 | 121,876 | 180,930 | 10 | yes |
| Handrails, railings, banisters | 2024 | 1,409 | 56,964 | 46,745 | 67,183 | 9.2 | yes |
| Handrails, railings, banisters | 2025 | 1,649 | 62,880 | 50,866 | 74,894 | 9.8 | yes |
| Fences or fence posts | 2024 | 2,823 | 118,863 | 101,226 | 136,500 | 7.6 | yes |
| Fences or fence posts | 2025 | 2,896 | 115,803 | 98,955 | 132,650 | 7.4 | yes |
| House repair/construction materials NEC | 2024 | 518 | 31,512 | 24,020 | 39,005 | 12.1 | yes |
| House repair/construction materials NEC | 2025 | 537 | 31,362 | 21,612 | 41,112 | 15.9 | yes |
| Nail guns | 2024 | 154 | 9,057 | 6,568 | 11,546 | 14 | yes |
| Nail guns | 2025 | 193 | 10,860 | 7,842 | 13,878 | 14.2 | yes |
| Scaffolding | 2024 | 97 | 5,411 | 3,506 | 7,317 | 18 | yes |
| Scaffolding | 2025 | 119 | 6,207 | 4,278 | 8,137 | 15.9 | yes |
| Roof falls (narrative-identified) | 2024 | 102 | 5,591 | 3,963 | 7,218 | 14.8 | yes |
| Roof falls (narrative-identified) | 2025 | 149 | 7,317 | 5,224 | 9,410 | 14.6 | yes |
How many construction workers die from falls?
Falls are the leading cause of death in US construction work. Falls, slips and trips caused 389 of the 1,034 fatal work injuries in the US construction industry in 2024, about 38%, the largest single event category (BLS CFOI). Counted by occupation instead of industry: Fatal falls, slips and trips killed 370 US construction and extraction workers in 2024, down from 400 in 2023, out of 1,032 deaths in those occupations (BLS Census of Fatal Occupational Injuries). These are deaths of workers on the job, counted by the Bureau of Labor Statistics. They do not include homeowners doing their own work, who are covered only by the emergency-department figures above.
| Industry | NAICS code | All fatal injuries | Falls, slips and trips |
|---|---|---|---|
| Construction | 23 | 1,034 | 389 |
| Specialty trade contractors | 238 | 606 | 253 |
| Roofing contractors | 23816 | 120 | 96 |
| Residential building construction | 2361 | 138 | 65 |
| Residential remodelers | 236118 | 64 | 29 |
| Framing contractors | 23813 | 39 | 22 |
| Masonry contractors | 23814 | 26 | 14 |
| Painting and wall covering contractors | 23832 | 23 | 16 |
How can planning the job reduce time on a ladder or roof?
Plan the job on the ground. Measure from the ground, work out the order once, and have the materials delivered to the right place. Each of these cuts climbs, carries and trips to the store. These tools do that planning from published code and manufacturer figures:
- The stair calculator sets equal risers and treads within the IRC and Approved Document K limits before you cut a stringer.
- The decking boards and screws tool sizes the board and fastener order, so you are not making extra trips mid-build.
- The materials for a wood fence tool counts posts, rails and post concrete per run.
- The roofing calculator works from a footprint and pitch you can take from the ground.
For drawings of these parts that you can reuse, see the CC BY building diagrams. The other data pages are in the construction and DIY statistics library.
How we built this data
Source. The US Consumer Product Safety Commission's National Electronic Injury Surveillance System (NEISS) records a sample of injuries treated in hospital emergency departments, with a weight on each case that scales it to a national estimate. We downloaded the public annual files for 2015 to 2025 and analysed them ourselves. We did not use CPSC's online query tool.
Product codes. A case counts for a group when any of its three product fields holds one of the group's codes. Each case is counted once per group. The groups are stairs or steps (1842); ladders, combining stepladders, straight and extension ladders and other ladders (618, 619, 688, 4032, 4033, 4077, 4078); step stools (620); porches, balconies, open-side floors and floor openings (1817); handrails, railings and banisters (1829); fences or fence posts (1871); house repair and construction materials not elsewhere classified (1876); nail guns and stud drivers (882); and scaffolding (1816). The codes for bricks and concrete blocks, lumber and boards, and post-hole augers and drivers returned no cases in any year, so we do not report them.
Roof falls. NEISS has no roof code. We flagged a case when its narrative mentions a fall followed shortly by 'roof', or a fall 'off the roof', and excluded phrases such as 'roof of the mouth'. Narratives are short and often leave out where the person fell from, so this count is a minimum.
Estimates and intervals. The national estimate is the sum of case weights. The standard error uses the with-replacement estimator over NEISS strata and primary sampling units, taking the list of units in each stratum from the full annual file so that hospitals with no matching cases still count. The 95% interval is the standard normal-approximation interval around the estimate.
Reliability. We apply CPSC's own rule and flag an estimate as unreliable when it rests on too few sample cases, gives too small a national total, or has too high a coefficient of variation. Body-part, diagnosis and age cells that fail the rule are left out of the tables. The CSV marks every row as reliable or not.
Check against CPSC. For 2024 our estimates match CPSC's published NEISS Data Highlights exactly for the three groups CPSC reports. That match confirms our coding and weighting. CPSC's 2025 Highlights were not available when we ran the analysis, so the 2025 figures have not been cross-checked the same way.
Limits. NEISS counts emergency-department visits, not all injuries. Someone treated at urgent care or by their own doctor is missing, and so is anyone who died before reaching hospital. It records the product involved, not whether it was faulty or how it was being used, so these are not counts of DIY accidents as such. A fence injury can be a child climbing a fence. The 2024 sample redesign breaks the series. The worker death figures come from a separate census, BLS CFOI, and the ladder-height figures from a 2011 NIOSH study of workers.
| Product group | Our 2024 estimate | CPSC published 2024 | Sample cases |
|---|---|---|---|
| Fences | 118,863 | 118,863 | 2,823 |
| Porches, open side floors | 151,222 | 151,222 | 3,127 |
| Handrails, railings, banisters | 56,964 | 56,964 | 1,409 |
How to cite this page
You can reuse the figures, tables and CSV on this page under the Creative Commons Attribution 4.0 licence (CC BY 4.0). Credit BuildersCalcs and link to this page. A citation line is in the box at the end of the page and copies with one click.
When you quote a figure, please keep three things with it: the year, the words 'emergency department' or 'ED-treated', and, where space allows, the 95% interval. A short form that works in most articles: 'an estimated 189,731 ladder injuries were treated in US emergency departments in 2025 (BuildersCalcs analysis of CPSC NEISS data)'. Please credit CPSC as the underlying source as well. Our part is the product grouping, the narrative search for roof falls and the interval calculation.
Download the data
One row per year, product group and breakdown (total, age group, sex, body part, diagnosis, disposition, location), with sample cases, estimate, standard error, 95% interval, CV, reliability flag and share of the group.
Questions about these injury figures
Are these figures DIY accidents only?
No. NEISS records the product involved in an emergency-department visit, not what the person was doing. A ladder injury may come from a homeowner cleaning gutters or a contractor at work. A fence injury may come from a child climbing over a fence. Treat the figures as injuries involving these products, which include DIY work but are not limited to it.
Why did stair and ladder injuries jump in 2024?
Mostly because the sample changed. CPSC started a redesigned hospital sample in 2024, and its all-product estimate rose sharply that year. Comparing 2023 with 2024 mixes real change with the new sample. Between 2024 and 2025, on the same sample, neither estimate moved by more than its interval.
Is the roof fall figure an undercount?
Yes. NEISS has no product code for roofs, so we found roof falls by searching each case's short narrative. Many narratives do not say where the person fell from, so the true number is higher than 7,317.
Do these numbers include deaths?
Not the NEISS figures. They count people treated in emergency departments. The death figures on this page are worker deaths from the BLS Census of Fatal Occupational Injuries and the 2011 NIOSH ladder study. We have no national count of deaths among homeowners doing their own building work.
Can I use these figures in my article or report?
Yes, under CC BY 4.0. Credit BuildersCalcs with a link to this page and name CPSC NEISS as the underlying data. Please quote the year and, where possible, the 95% interval.
Cite this page
You may reuse the figures and downloads on this page under CC BY 4.0. Please credit BuildersCalcs with a link to this page.
Sources (15)
- American Wood Council
- DCA 6 - Prescriptive Residential Wood Deck Construction Guide (2015 IRC version, (c)2018, incl. Commentary), checked
- Asphalt Roofing Manufacturers Association (ARMA)
- Residential Asphalt Roofing Manual - Design and Application Methods, 2014 edition (Ch. 5 Estimating; Ch. 6 Safety), checked
- CDC NIOSH (MMWR)
- Occupational Ladder Fall Injuries — United States, 2011 (Socias et al., MMWR 2014;63(16)), checked
- City of Boise Building Division
- IRC Code Handout #437 - IRC Section R311.7.5 Stair Treads & Risers (02/2022), checked
- City of Gilroy Building Division
- Residential Stairways, Handrails and Guards handout - California Residential Code R311.7 and R312 (rev. 03/03/2025), checked
- LABC Warranty (MD Insurance Services)
- Technical Manual Version 11 - Section 9: Stairs, checked
- UK Government (MHCLG)
- Approved Document K: Protection from falling, collision and impact (2013 edition, online version), checked
- US Bureau of Labor Statistics
- CFOI Table A-1. Fatal occupational injuries by industry and event or exposure, all United States, 2024, checked
- National Census of Fatal Occupational Injuries in 2024 (news release USDL, 19 Feb 2026), checked
- US Consumer Product Safety Commission
- NEISS Data Highlights – Calendar Year 2023, checked
- NEISS Data Highlights – Calendar Year 2024, checked
- NEISS annual data files 2015–2025 (neiss<year>.xlsx, NEISS_FMT code sheet), checked
- US Consumer Product Safety Commission (Federal Register)
- Agency Information Collection Activities; NEISS — FR Doc. 2021-23302, Docket CPSC-2009-0102, checked
- US OSHA (29 CFR via Cornell LII)
- 29 CFR 1926.1053 Ladders, checked
- 29 CFR 1926.501 Duty to have fall protection, checked
Every number on this page is taken from these documents. How we choose and check sources.